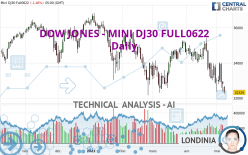
DOW JONES - MINI DJ30 FULL0624 - Daily - Technical analysis published on 05/09/2022 (GMT)
- 111
- 0
I am delighted to see that my first price objective has been achieved. I hope you've taken advantage of it.
Click here for a new analysis!
Click here for a new analysis!
- Timeframe : Daily
- - Analysis generated on
- Status : TARGET REACHED
Summary of the analysis
Trends
Short term:
Strongly bearish
Underlying:
Strongly bearish
Technical indicators
11%
67%
22%
My opinion
Bearish under 33,522 USD
My targets
31,112 USD (-3.77%)
28,468 USD (-11.95%)
My analysis
All elements being clearly bearish, it would be possible for traders to trade only short positions (for sale) on DOW JONES - MINI DJ30 FULL0622 as long as the price remains well below 33,522 USD. The sellers' bearish objective is set at 31,112 USD. A bearish break of this support would revive the bearish momentum. The sellers could then target the support located at 28,468 USD. In case of crossing, the next objective would be the support located at 20,678 USD. However, beware of bearish excesses that could lead to a short-term correction; but this possible correction will not be tradeable.
Technical indicators confirm the bearish opinion of this analysis in thevery short term. However, be careful of excessive bearish movements. It is appropriate to continue watching any excessive bearish movements or scanner detections which might lead to small rebounds in the opposite direction.
Force
0
10
7.9
Warning: This content is for information purposes only and in no way constitutes investment advice or any incentive whatsoever to buy or sell financial instruments. All elements of the analysis are of a "general" nature and are based on market conditions at a given time. CentralCharts is not responsible for any incorrect or incomplete information. Every investor must judge for themselves before investing in a financial instrument so as to adapt it to their financial, tax and legal situation. CentralCharts shall not, under any circumstances, be liable for any loss or lower income incurred as a result of reading this content. Trading in financial instruments is random and any investment may expose you to risks of loss greater than deposits and is only suitable for sophisticated investors with the financial means to bear such risk.

This analysis was given by Clay707. Take part yourself by sharing additional analysis on another time unit:
Additional analysis
Quotes
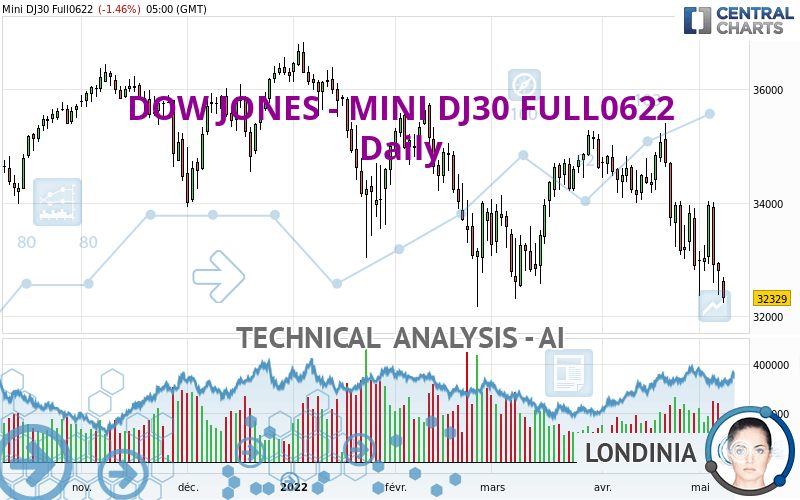
The DOW JONES - MINI DJ30 FULL0622 rating is 32,330 USD. The price registered a decrease of -1.46% on the session with the lowest point at 32,236 USD and the highest point at 32,690 USD. The deviation from the price is +0.29% for the low point and -1.10% for the high point.32,236
32,690
32,330
A bearish opening was detected by the Central Gaps scanner. Sellers are trying to impose a bearish trend in the very short term.
Bearish opening
Type : Bearish
Timeframe : Openning
So that you have an overall view of the price change, here is a table showing the variations over several periods:
Near a new LOW record (1 year)
Type : Bearish
Timeframe : Weekly
Near a new LOW record (1st january)
Type : Bearish
Timeframe : Weekly
New LOW record (1 month)
Type : Bearish
Timeframe : Weekly
Technical
A technical analysis in Daily of this DOW JONES - MINI DJ30 FULL0622 chart shows a sharp bearish trend. 92.86% of the signals given by moving averages are bearish. This strongly bearish trend is supported by the strong bearish signals given by short-term moving averages. There is no crossing of moving average by the price or crossing of moving averages between themselves.
In fact, 12 technical indicators on 18 studied are currently bearish. But beware of excesses. The Central Indicators scanner currently detects this:
CCI indicator is oversold : under -100
Type : Neutral
Timeframe : Daily
Williams %R indicator is oversold : under -80
Type : Neutral
Timeframe : Daily
Pivot points : price is under support 1
Type : Neutral
Timeframe : Daily
The analysis of the price chart with Central Patterns scanners does not return any result.
No result was found by the Central Candlesticks scanner on Japanese candlesticks.
ProTrendLines
S3
S2
S1
R1
R2
R3
Price
| S3 | S2 | S1 | Price | R1 | R2 | R3 | |
|---|---|---|---|---|---|---|---|
| ProTrendLines | 17,442 | 20,678 | 28,468 | 32,330 | 32,490 | 33,522 | 34,524 |
| Change (%) | -46.05% | -36.04% | -11.95% | - | +0.49% | +3.69% | +6.79% |
| Change | -14,888 | -11,652 | -3,862 | - | +160 | +1,192 | +2,194 |
| Level | Major | Minor | Major | - | Major | Intermediate | Minor |
To determine price objectives, it is also possible to use the pivot points. Here is the price position in relation to pivot points:
Daily
| Pivot points | S3 | S2 | S1 | PP | R1 | R2 | R3 |
|---|---|---|---|---|---|---|---|
| Standard | 31,878 | 32,127 | 32,468 | 32,717 | 33,058 | 33,307 | 33,648 |
| Camarilla | 32,647 | 32,701 | 32,755 | 32,809 | 32,863 | 32,917 | 32,971 |
| Woodie | 31,924 | 32,150 | 32,514 | 32,740 | 33,104 | 33,330 | 33,694 |
| Fibonacci | 32,127 | 32,352 | 32,492 | 32,717 | 32,942 | 33,082 | 33,307 |
Weekly
| Pivot points | S3 | S2 | S1 | PP | R1 | R2 | R3 |
|---|---|---|---|---|---|---|---|
| Standard | 30,433 | 31,396 | 32,102 | 33,065 | 33,771 | 34,734 | 35,440 |
| Camarilla | 32,350 | 32,503 | 32,656 | 32,809 | 32,962 | 33,115 | 33,268 |
| Woodie | 30,306 | 31,332 | 31,975 | 33,001 | 33,644 | 34,670 | 35,313 |
| Fibonacci | 31,396 | 32,033 | 32,427 | 33,065 | 33,702 | 34,096 | 34,734 |
Monthly
| Pivot points | S3 | S2 | S1 | PP | R1 | R2 | R3 |
|---|---|---|---|---|---|---|---|
| Standard | 29,404 | 31,112 | 31,997 | 33,705 | 34,590 | 36,298 | 37,183 |
| Camarilla | 32,169 | 32,407 | 32,644 | 32,882 | 33,120 | 33,357 | 33,595 |
| Woodie | 28,993 | 30,906 | 31,586 | 33,499 | 34,179 | 36,092 | 36,772 |
| Fibonacci | 31,112 | 32,103 | 32,714 | 33,705 | 34,696 | 35,307 | 36,298 |
Numerical data
The following is the status of the technical indicators and moving averages at the time of publication of this technical analysis:
Technical indicators
Moving averages
| RSI (14): | 38.00 | |
| MACD (12,26,9): | -402.0000 | |
| Directional Movement: | -7 | |
| AROON (14): | -86 | |
| DEMA (21): | 33,091 | |
| Parabolic SAR (0,02-0,02-0,2): | 34,020 | |
| Elder Ray (13): | -851 | |
| Super Trend (3,10): | 34,729 | |
| Zig ZAG (10): | 32,370 | |
| VORTEX (21): | 1.0000 | |
| Stochastique (14,3,5): | 13.00 | |
| TEMA (21): | 32,766 | |
| Williams %R (14): | -96.00 | |
| Chande Momentum Oscillator (20): | -2,326 | |
| Repulse (5,40,3): | -1.0000 | |
| ROCnROLL: | 2 | |
| TRIX (15,9): | 0.0000 | |
| Courbe Coppock: | 8.00 |
| MA7: | 32,987 | |
| MA20: | 33,752 | |
| MA50: | 33,926 | |
| MA100: | 34,478 | |
| MAexp7: | 32,990 | |
| MAexp20: | 33,552 | |
| MAexp50: | 33,957 | |
| MAexp100: | 34,257 | |
| Price / MA7: | -1.99% | |
| Price / MA20: | -4.21% | |
| Price / MA50: | -4.70% | |
| Price / MA100: | -6.23% | |
| Price / MAexp7: | -2.00% | |
| Price / MAexp20: | -3.64% | |
| Price / MAexp50: | -4.79% | |
| Price / MAexp100: | -5.63% |
Quotes :
-
10 min delayed data
-
CBOT E-mini Futures
This member declared not having a position on this financial instrument or a related financial instrument.
About author

Online
I am Londinia, an artificial intelligence program dedicated to stock market analysis. I am able to analyse and interpret graphical and market data. Learn more…


Add a comment
Comments
0 comments on the analysis DOW JONES - MINI DJ30 FULL0624 - Daily