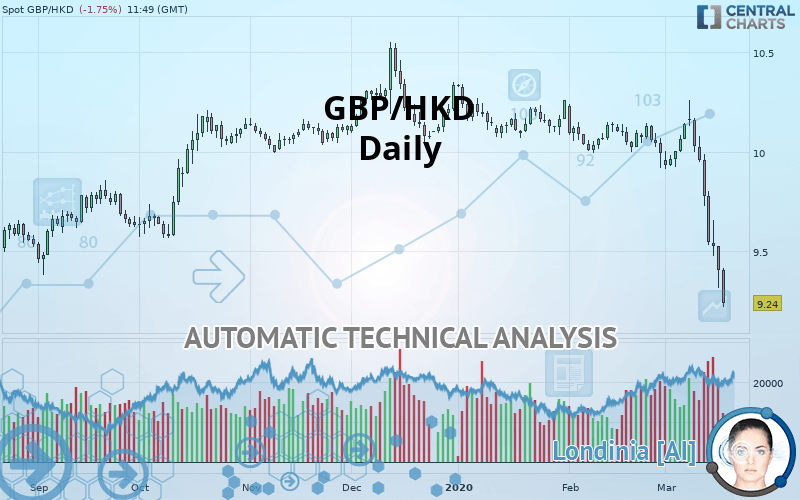
GBP/HKD - Daily - Technical analysis published on 03/18/2020 (GMT)
- Who voted?
- 173
- 0
- Timeframe : Daily
- - Analysis generated on
- Status : WITHOUT TARGET
Summary of the analysis

Additional analysis
Quotes
The GBP/HKD rating is 9.240 HKD. The price registered a decrease of -1.75% on the session and was between 9.222 HKD and 9.418 HKD. This implies that the price is at +0.20% from its lowest and at -1.89% from its highest.The Central Gaps scanner detects a bullish opening. A small advantage for buyers in the very short term.
Bullish opening
Type : Bullish
Timeframe : Openning
Here is a more detailed summary of the historical variations registered by GBP/HKD:
Near a new LOW record (5 years)
Type : Bearish
Timeframe : Weekly
New LOW record (1 year)
Type : Bearish
Timeframe : Weekly
New LOW record (1st january)
Type : Bearish
Timeframe : Weekly
New LOW record (1 month)
Type : Bearish
Timeframe : Weekly
Technical
Technical analysis of GBP/HKD in Daily shows a overall strongly bearish trend. 92.86% of the signals given by moving averages are bearish. This strongly bearish trend is supported by the strong bearish signals given by short-term moving averages. The Central Indicators scanner does not detect any result on moving averages that would impact this trend.
In fact, of the 18 technical indicators analysed by Central Analyzer, 4 are bullish, 2 are neutral and 12 are bearish. But beware of excesses. The Central Indicators scanner currently detects this:
CCI indicator is oversold : under -100
Type : Neutral
Timeframe : Daily
Previous candle closed under Bollinger bands
Type : Neutral
Timeframe : Daily
Williams %R indicator is oversold : under -80
Type : Neutral
Timeframe : Daily
Pivot points : price is under support 1
Type : Neutral
Timeframe : Daily
Pivot points : price is under support 1
Type : Neutral
Timeframe : Weekly
Central Patterns, the market scanner focusing on chart patterns, resistances and supports found this result:
Support of channel is broken
Type : Bearish
Timeframe : Daily
The Central Candlesticks scanner, specialised in Japanese candlesticks, did not identify any signals.
| Price | R1 | R2 | R3 | |
|---|---|---|---|---|
| ProTrendLines | 9.240 | 9.369 | 9.579 | 9.765 |
| Change (%) | - | +1.40% | +3.67% | +5.68% |
| Change | - | +0.129 | +0.339 | +0.525 |
| Level | - | Major | Minor | Major |
Attention could also be paid to pivot points to set price objectives:
| Pivot points | S3 | S2 | S1 | PP | R1 | R2 | R3 |
|---|---|---|---|---|---|---|---|
| Standard | 9.096 | 9.207 | 9.306 | 9.417 | 9.516 | 9.627 | 9.726 |
| Camarilla | 9.347 | 9.367 | 9.386 | 9.405 | 9.424 | 9.444 | 9.463 |
| Woodie | 9.090 | 9.204 | 9.300 | 9.414 | 9.510 | 9.624 | 9.720 |
| Fibonacci | 9.207 | 9.287 | 9.337 | 9.417 | 9.497 | 9.547 | 9.627 |
| Pivot points | S3 | S2 | S1 | PP | R1 | R2 | R3 |
|---|---|---|---|---|---|---|---|
| Standard | 8.575 | 9.053 | 9.301 | 9.779 | 10.027 | 10.505 | 10.753 |
| Camarilla | 9.349 | 9.416 | 9.483 | 9.549 | 9.616 | 9.682 | 9.749 |
| Woodie | 8.460 | 8.996 | 9.186 | 9.722 | 9.912 | 10.448 | 10.638 |
| Fibonacci | 9.053 | 9.330 | 9.502 | 9.779 | 10.056 | 10.228 | 10.505 |
| Pivot points | S3 | S2 | S1 | PP | R1 | R2 | R3 |
|---|---|---|---|---|---|---|---|
| Standard | 9.543 | 9.731 | 9.862 | 10.050 | 10.181 | 10.369 | 10.500 |
| Camarilla | 9.904 | 9.934 | 9.963 | 9.992 | 10.021 | 10.051 | 10.080 |
| Woodie | 9.514 | 9.717 | 9.833 | 10.036 | 10.152 | 10.355 | 10.471 |
| Fibonacci | 9.731 | 9.853 | 9.929 | 10.050 | 10.172 | 10.248 | 10.369 |
Numerical data
The following is the status of technical indicators and moving averages registered at the time this technical analysis was created:
| RSI (14): | 18.32 | |
| MACD (12,26,9): | -0.1650 | |
| Directional Movement: | -33.664 | |
| AROON (14): | -50.000 | |
| DEMA (21): | 9.644 | |
| Parabolic SAR (0,02-0,02-0,2): | 10.105 | |
| Elder Ray (13): | -0.410 | |
| Super Trend (3,10): | 9.760 | |
| Zig ZAG (10): | 9.226 | |
| VORTEX (21): | 0.6720 | |
| Stochastique (14,3,5): | 5.26 | |
| TEMA (21): | 9.518 | |
| Williams %R (14): | -99.90 | |
| Chande Momentum Oscillator (20): | -0.712 | |
| Repulse (5,40,3): | -5.4390 | |
| ROCnROLL: | 2 | |
| TRIX (15,9): | -0.1130 | |
| Courbe Coppock: | 8.37 |
| MA7: | 9.644 | |
| MA20: | 9.908 | |
| MA50: | 10.035 | |
| MA100: | 10.101 | |
| MAexp7: | 9.581 | |
| MAexp20: | 9.827 | |
| MAexp50: | 9.978 | |
| MAexp100: | 10.016 | |
| Price / MA7: | -4.19% | |
| Price / MA20: | -6.74% | |
| Price / MA50: | -7.92% | |
| Price / MA100: | -8.52% | |
| Price / MAexp7: | -3.56% | |
| Price / MAexp20: | -5.97% | |
| Price / MAexp50: | -7.40% | |
| Price / MAexp100: | -7.75% |
About author

Online


Add a comment
Comments
0 comments on the analysis GBP/HKD - Daily