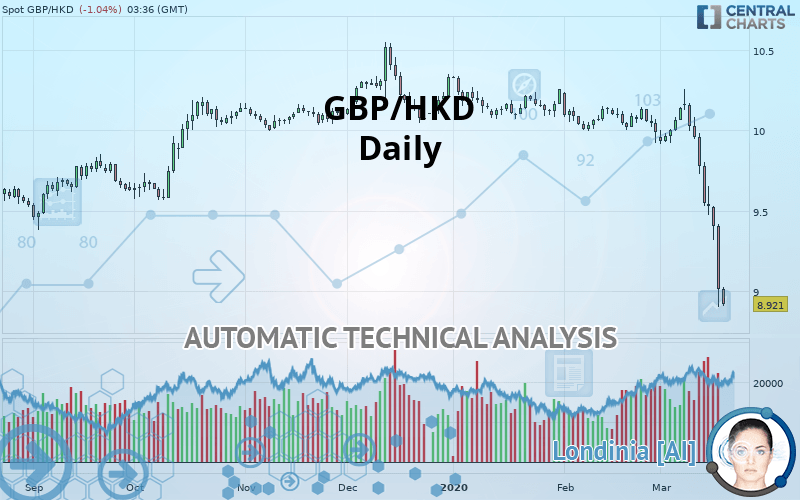
GBP/HKD - Daily - Technical analysis published on 03/19/2020 (GMT)
- Who voted?
- 204
- 0
- Timeframe : Daily
- - Analysis generated on
- Status : WITHOUT TARGET
Summary of the analysis

Additional analysis
Quotes
The GBP/HKD price is 8.922 HKD. On the day, this instrument lost -1.03% and was between 8.911 HKD and 9.026 HKD. This implies that the price is at +0.12% from its lowest and at -1.15% from its highest.A study of price movements over other periods shows the following variations:
New LOW record (5 years)
Type : Bearish
Timeframe : Weekly
Near a new LOW record (1st january)
Type : Bearish
Timeframe : Weekly
Near a new LOW record (1 month)
Type : Bearish
Timeframe : Weekly
Technical
Technical analysis of GBP/HKD in Daily shows a overall strongly bearish trend. 92.86% of the signals given by moving averages are bearish. This strongly bearish trend is supported by the strong bearish signals given by short-term moving averages. An assessment of moving averages reveals a bearish signal that could impact this trend:
Moving Average bearish crossovers : AMA50 & AMA100
Type : Bearish
Timeframe : Daily
An assessment of technical indicators shows a bearish signal.
Caution: the Central Indicators scanner currently detects an excess:
RSI indicator is oversold : under 20
Type : Neutral
Timeframe : Daily
CCI indicator is oversold : under -100
Type : Neutral
Timeframe : Daily
Williams %R indicator is oversold : under -80
Type : Neutral
Timeframe : Daily
Pivot points : price is under support 3
Type : Neutral
Timeframe : Weekly
Price is back under the pivot point
Type : Bearish
Timeframe : Daily
Central Patterns, the market scanner focusing on chart patterns, resistances and supports found this result:
Support of channel is broken
Type : Bearish
Timeframe : Daily
Central Candlesticks, the scanner specialised in Japanese candlesticks, detects a bearish signal that could support the hypothesis of a small drop in the very short term:
Long black line
Type : Bearish
Timeframe : Daily
| Price | R1 | R2 | R3 | |
|---|---|---|---|---|
| ProTrendLines | 8.922 | 9.369 | 9.579 | 9.765 |
| Change (%) | - | +5.01% | +7.36% | +9.45% |
| Change | - | +0.447 | +0.657 | +0.843 |
| Level | - | Major | Minor | Major |
Attention could also be paid to pivot points to set price objectives:
| Pivot points | S3 | S2 | S1 | PP | R1 | R2 | R3 |
|---|---|---|---|---|---|---|---|
| Standard | 8.291 | 8.597 | 8.806 | 9.112 | 9.321 | 9.627 | 9.836 |
| Camarilla | 8.873 | 8.921 | 8.968 | 9.015 | 9.062 | 9.109 | 9.157 |
| Woodie | 8.243 | 8.573 | 8.758 | 9.088 | 9.273 | 9.603 | 9.788 |
| Fibonacci | 8.597 | 8.794 | 8.915 | 9.112 | 9.309 | 9.430 | 9.627 |
| Pivot points | S3 | S2 | S1 | PP | R1 | R2 | R3 |
|---|---|---|---|---|---|---|---|
| Standard | 8.575 | 9.053 | 9.301 | 9.779 | 10.027 | 10.505 | 10.753 |
| Camarilla | 9.349 | 9.416 | 9.483 | 9.549 | 9.616 | 9.682 | 9.749 |
| Woodie | 8.460 | 8.996 | 9.186 | 9.722 | 9.912 | 10.448 | 10.638 |
| Fibonacci | 9.053 | 9.330 | 9.502 | 9.779 | 10.056 | 10.228 | 10.505 |
| Pivot points | S3 | S2 | S1 | PP | R1 | R2 | R3 |
|---|---|---|---|---|---|---|---|
| Standard | 9.543 | 9.731 | 9.862 | 10.050 | 10.181 | 10.369 | 10.500 |
| Camarilla | 9.904 | 9.934 | 9.963 | 9.992 | 10.021 | 10.051 | 10.080 |
| Woodie | 9.514 | 9.717 | 9.833 | 10.036 | 10.152 | 10.355 | 10.471 |
| Fibonacci | 9.731 | 9.853 | 9.929 | 10.050 | 10.172 | 10.248 | 10.369 |
Numerical data
The following is the status of the technical indicators and moving averages at the time of publication of this technical analysis:
| RSI (14): | 14.15 | |
| MACD (12,26,9): | -0.2300 | |
| Directional Movement: | -41.229 | |
| AROON (14): | -50.000 | |
| DEMA (21): | 9.470 | |
| Parabolic SAR (0,02-0,02-0,2): | 9.985 | |
| Elder Ray (13): | -0.620 | |
| Super Trend (3,10): | 9.485 | |
| Zig ZAG (10): | 8.914 | |
| VORTEX (21): | 0.6190 | |
| Stochastique (14,3,5): | 6.14 | |
| TEMA (21): | 9.291 | |
| Williams %R (14): | -99.34 | |
| Chande Momentum Oscillator (20): | -1.049 | |
| Repulse (5,40,3): | -6.7420 | |
| ROCnROLL: | 2 | |
| TRIX (15,9): | -0.1550 | |
| Courbe Coppock: | 12.02 |
| MA7: | 9.450 | |
| MA20: | 9.842 | |
| MA50: | 10.006 | |
| MA100: | 10.087 | |
| MAexp7: | 9.369 | |
| MAexp20: | 9.722 | |
| MAexp50: | 9.928 | |
| MAexp100: | 9.990 | |
| Price / MA7: | -5.59% | |
| Price / MA20: | -9.35% | |
| Price / MA50: | -10.83% | |
| Price / MA100: | -11.55% | |
| Price / MAexp7: | -4.77% | |
| Price / MAexp20: | -8.23% | |
| Price / MAexp50: | -10.13% | |
| Price / MAexp100: | -10.69% |
About author

Online


Add a comment
Comments
0 comments on the analysis GBP/HKD - Daily