GBP/JPY - Daily - Technical analysis published on 10/29/2020 (GMT)
- 131
- 0
Click here for a new analysis!
- Timeframe : Daily
- - Analysis generated on
- Status : TARGET REACHED

Summary of the analysis

Additional analysis
Quotes
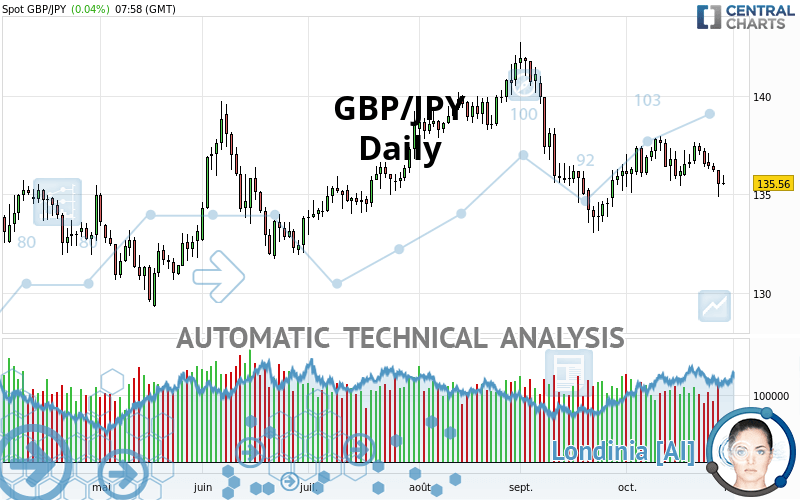
The GBP/JPY rating is 135.56 JPY. On the day, this instrument gained +0.04% and was between 135.47 JPY and 135.96 JPY. This implies that the price is at +0.07% from its lowest and at -0.29% from its highest.Here is a more detailed summary of the historical variations registered by GBP/JPY:
Technical
A technical analysis in Daily of this GBP/JPY chart shows a bearish trend. 71.43% of the signals given by moving averages are bearish. The overall trend is reinforced by the strong bearish signals from short-term moving averages. An assessment of moving averages reveals several bearish signals that could impact this trend:
Bearish trend reversal : Moving Average 20
Type : Bearish
Timeframe : Daily
Bearish price crossover with adaptative moving average 100
Type : Bearish
Timeframe : Daily
In fact, 13 technical indicators on 18 studied are currently bearish. Caution: the Central Indicators scanner currently detects an excess:
CCI indicator is oversold : under -100
Type : Neutral
Timeframe : Daily
Williams %R indicator is oversold : under -80
Type : Neutral
Timeframe : Daily
Pivot points : price is under support 3
Type : Neutral
Timeframe : Weekly
MACD crosses DOWN its Moving Average
Type : Bearish
Timeframe : Daily
Parabolic SAR indicator bearish reversal
Type : Bearish
Timeframe : Daily
SuperTrend indicator bearish reversal
Type : Bearish
Timeframe : Daily
Price is back under the pivot point
Type : Bearish
Timeframe : Daily
Central Patterns, the market scanner focusing on chart patterns, resistances and supports found these results:
Near horizontal support
Type : Bullish
Timeframe : Daily
Near support of triangle
Type : Bullish
Timeframe : Daily
Support of channel is broken
Type : Bearish
Timeframe : Daily
The Central Candlesticks scanner, specialised in Japanese candlesticks, did not identify any signals.
| S3 | S2 | S1 | Price | R1 | R2 | R3 | |
|---|---|---|---|---|---|---|---|
| ProTrendLines | 129.65 | 132.46 | 134.45 | 135.56 | 138.84 | 141.91 | 144.55 |
| Change (%) | -4.36% | -2.29% | -0.82% | - | +2.42% | +4.68% | +6.63% |
| Change | -5.91 | -3.10 | -1.11 | - | +3.28 | +6.35 | +8.99 |
| Level | Intermediate | Minor | Major | - | Intermediate | Intermediate | Minor |
To determine price objectives, it is also possible to use the pivot points. Here is the price position in relation to pivot points:
| Pivot points | S3 | S2 | S1 | PP | R1 | R2 | R3 |
|---|---|---|---|---|---|---|---|
| Standard | 133.48 | 134.18 | 134.84 | 135.54 | 136.20 | 136.90 | 137.56 |
| Camarilla | 135.13 | 135.25 | 135.38 | 135.50 | 135.63 | 135.75 | 135.87 |
| Woodie | 133.46 | 134.17 | 134.82 | 135.53 | 136.18 | 136.89 | 137.54 |
| Fibonacci | 134.18 | 134.70 | 135.02 | 135.54 | 136.06 | 136.38 | 136.90 |
| Pivot points | S3 | S2 | S1 | PP | R1 | R2 | R3 |
|---|---|---|---|---|---|---|---|
| Standard | 179.93 | 181.65 | 182.90 | 184.62 | 185.87 | 187.59 | 188.84 |
| Camarilla | 183.32 | 183.60 | 183.87 | 184.14 | 184.41 | 184.68 | 184.96 |
| Woodie | 179.69 | 181.53 | 182.66 | 184.50 | 185.63 | 187.47 | 188.60 |
| Fibonacci | 181.65 | 182.79 | 183.49 | 184.62 | 185.76 | 186.46 | 187.59 |
| Pivot points | S3 | S2 | S1 | PP | R1 | R2 | R3 |
|---|---|---|---|---|---|---|---|
| Standard | 137.04 | 138.44 | 137.44 | 138.84 | 137.84 | 139.24 | 138.24 |
| Camarilla | 136.33 | 136.37 | 136.40 | 136.44 | 136.48 | 136.51 | 136.55 |
| Woodie | 135.84 | 137.84 | 136.24 | 138.24 | 136.64 | 138.64 | 137.04 |
| Fibonacci | 138.44 | 138.59 | 138.69 | 138.84 | 138.99 | 139.09 | 139.24 |
Numerical data
The following is the status of the technical indicators and moving averages at the time of publication of this technical analysis:
| RSI (14): | 44.99 | |
| MACD (12,26,9): | -0.0700 | |
| Directional Movement: | -9.29 | |
| AROON (14): | -14.29 | |
| DEMA (21): | 136.59 | |
| Parabolic SAR (0,02-0,02-0,2): | 140.13 | |
| Elder Ray (13): | -0.93 | |
| Super Trend (3,10): | 140.18 | |
| Zig ZAG (10): | 135.61 | |
| VORTEX (21): | 0.9900 | |
| Stochastique (14,3,5): | 14.24 | |
| TEMA (21): | 136.68 | |
| Williams %R (14): | -85.82 | |
| Chande Momentum Oscillator (20): | -1.15 | |
| Repulse (5,40,3): | -0.4400 | |
| ROCnROLL: | 2 | |
| TRIX (15,9): | 0.0000 | |
| Courbe Coppock: | 0.30 |
| MA7: | 136.81 | |
| MA20: | 136.83 | |
| MA50: | 137.21 | |
| MA100: | 136.60 | |
| MAexp7: | 136.52 | |
| MAexp20: | 136.66 | |
| MAexp50: | 136.79 | |
| MAexp100: | 136.67 | |
| Price / MA7: | -0.91% | |
| Price / MA20: | -0.93% | |
| Price / MA50: | -1.20% | |
| Price / MA100: | -0.76% | |
| Price / MAexp7: | -0.70% | |
| Price / MAexp20: | -0.80% | |
| Price / MAexp50: | -0.90% | |
| Price / MAexp100: | -0.81% |
News
The last news published on GBP/JPY at the time of the generation of this analysis was as follows:
-
 GBP/JPY Technical Analysis for October 29, 2020 by FXEmpire
-
GBP/JPY Technical Analysis for October 28, 2020 by FXEmpire
-
GBP/JPY Technical Analysis for October 27, 2020 by FXEmpire
-
GBP/JPY Technical Analysis for the Week of October 26, 2020 by FXEmpire
-
GBP/JPY Technical Analysis for October 26, 2020 by FXEmpire
About author

Online


Add a comment
Comments
0 comments on the analysis GBP/JPY - Daily