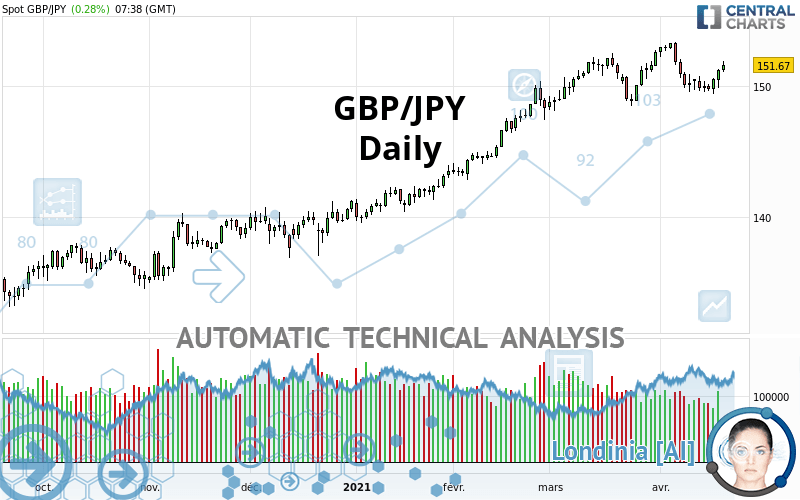
GBP/JPY - Daily - Technical analysis published on 04/20/2021 (GMT)
- 191
- 0
Click here for a new analysis!
- Timeframe : Daily
- - Analysis generated on
- Status : TARGET REACHED

Summary of the analysis

Additional analysis
Quotes
The GBP/JPY price is 151.68 JPY. The price registered an increase of +0.28% on the session and was between 151.09 JPY and 151.99 JPY. This implies that the price is at +0.39% from its lowest and at -0.20% from its highest.The Central Gaps scanner detects a bullish opening marking the presence of buyers ahead of sellers at the opening but not sufficiently marked to allow the price to register a quotation gap.
Bullish opening
Type : Bullish
Timeframe : Openning
So that you have an overall view of the price change, here is a table showing the variations over several periods:
Near a new HIGH record (1st january)
Type : Bullish
Timeframe : Weekly
Technical
Technical analysis of GBP/JPY in Daily shows a strongly overall bullish trend. 92.86% of the signals given by moving averages are bullish. The overall trend is supported by the strong bullish signals from short-term moving averages. The Central Indicators scanner detects bullish signals on moving averages that could impact this trend:
Bullish trend reversal : Moving Average 20
Type : Bullish
Timeframe : Daily
Bullish trend reversal : adaptative moving average 20
Type : Bullish
Timeframe : Daily
Bullish price crossover with Moving Average 20
Type : Bullish
Timeframe : Daily
Bullish price crossover with adaptative moving average 50
Type : Bullish
Timeframe : Daily
On the 18 technical indicators analysed, 10 are bullish, 4 are neutral and 4 are bearish. Caution: the Central Indicators scanner currently detects an excess:
MACD indicator: bearish divergence
Type : Bearish
Timeframe : Daily
MACD indicator: bullish divergence
Type : Bullish
Timeframe : Daily
RSI indicator: bullish divergence
Type : Bullish
Timeframe : Daily
Williams %R indicator is overbought : over -20
Type : Neutral
Timeframe : Daily
Pivot points : price is over resistance 2
Type : Neutral
Timeframe : Weekly
Pivot points : price is over resistance 3
Type : Neutral
Timeframe : Daily
Pivot points : price is under support 3
Type : Neutral
Timeframe : Daily
Pivot points : price is under support 3
Type : Neutral
Timeframe : Weekly
Ichimoku - Bearish crossover : Tenkan & Kijun
Type : Bearish
Timeframe : Daily
The Central Patterns scanner, which studies chart patterns, resistances and supports, has identified this signal:
Near support of channel
Type : Bullish
Timeframe : Daily
No result was found by the Central Candlesticks scanner on Japanese candlesticks.
| S3 | S2 | S1 | Price | R1 | R2 | R3 | |
|---|---|---|---|---|---|---|---|
| ProTrendLines | 141.91 | 147.40 | 148.92 | 151.68 | 152.69 | 156.17 | 195.62 |
| Change (%) | -6.44% | -2.82% | -1.82% | - | +0.67% | +2.96% | +28.97% |
| Change | -9.77 | -4.28 | -2.76 | - | +1.01 | +4.49 | +43.94 |
| Level | Major | Intermediate | Minor | - | Intermediate | Intermediate | Intermediate |
To determine price objectives, it is also possible to use the pivot points. Here is the price position in relation to pivot points:
| Pivot points | S3 | S2 | S1 | PP | R1 | R2 | R3 |
|---|---|---|---|---|---|---|---|
| Standard | 148.88 | 149.38 | 150.32 | 150.82 | 151.76 | 152.26 | 153.20 |
| Camarilla | 150.85 | 150.99 | 151.12 | 151.25 | 151.38 | 151.51 | 151.65 |
| Woodie | 149.09 | 149.49 | 150.53 | 150.93 | 151.97 | 152.37 | 153.41 |
| Fibonacci | 149.38 | 149.93 | 150.27 | 150.82 | 151.37 | 151.71 | 152.26 |
| Pivot points | S3 | S2 | S1 | PP | R1 | R2 | R3 |
|---|---|---|---|---|---|---|---|
| Standard | 148.26 | 148.83 | 149.71 | 150.28 | 151.16 | 151.73 | 152.61 |
| Camarilla | 150.20 | 150.33 | 150.47 | 150.60 | 150.73 | 150.87 | 151.00 |
| Woodie | 148.43 | 148.91 | 149.88 | 150.36 | 151.33 | 151.81 | 152.78 |
| Fibonacci | 148.83 | 149.38 | 149.72 | 150.28 | 150.83 | 151.17 | 151.73 |
| Pivot points | S3 | S2 | S1 | PP | R1 | R2 | R3 |
|---|---|---|---|---|---|---|---|
| Standard | 144.92 | 146.51 | 149.60 | 151.19 | 154.28 | 155.87 | 158.96 |
| Camarilla | 151.39 | 151.82 | 152.25 | 152.68 | 153.11 | 153.54 | 153.97 |
| Woodie | 145.66 | 146.89 | 150.34 | 151.57 | 155.02 | 156.25 | 159.70 |
| Fibonacci | 146.51 | 148.30 | 149.41 | 151.19 | 152.98 | 154.09 | 155.87 |
Numerical data
The following is the status of technical indicators and moving averages registered at the time this technical analysis was created:
| RSI (14): | 57.76 | |
| MACD (12,26,9): | 0.2300 | |
| Directional Movement: | 9.08 | |
| AROON (14): | -57.14 | |
| DEMA (21): | 151.32 | |
| Parabolic SAR (0,02-0,02-0,2): | 152.05 | |
| Elder Ray (13): | 0.62 | |
| Super Trend (3,10): | 153.02 | |
| Zig ZAG (10): | 151.85 | |
| VORTEX (21): | 1.0400 | |
| Stochastique (14,3,5): | 45.66 | |
| TEMA (21): | 150.67 | |
| Williams %R (14): | -38.46 | |
| Chande Momentum Oscillator (20): | -1.21 | |
| Repulse (5,40,3): | 1.3800 | |
| ROCnROLL: | 1 | |
| TRIX (15,9): | 0.0300 | |
| Courbe Coppock: | 1.27 |
| MA7: | 150.55 | |
| MA20: | 151.11 | |
| MA50: | 149.95 | |
| MA100: | 145.45 | |
| MAexp7: | 150.93 | |
| MAexp20: | 150.84 | |
| MAexp50: | 149.33 | |
| MAexp100: | 146.44 | |
| Price / MA7: | +0.75% | |
| Price / MA20: | +0.38% | |
| Price / MA50: | +1.15% | |
| Price / MA100: | +4.28% | |
| Price / MAexp7: | +0.50% | |
| Price / MAexp20: | +0.56% | |
| Price / MAexp50: | +1.57% | |
| Price / MAexp100: | +3.58% |
News
The last news published on GBP/JPY at the time of the generation of this analysis was as follows:
-
 GBP/JPY Technical Analysis for April 20, 2021 by FXEmpire
-
GBP/JPY Technical Analysis for the Week of April 19, 2021 by FXEmpire
-
GBP/JPY Technical Analysis for April 19, 2021 by FXEmpire
-
GBP/JPY Technical Analysis for April 16, 2021 by FXEmpire
-
GBP/JPY Technical Analysis for April 15, 2021 by FXEmpire
About author

Online


Add a comment
Comments
0 comments on the analysis GBP/JPY - Daily