GBP/JPY - Correction Towards 38.2% Fibo Level - 01/10/2017 (GMT)
- Who voted?
- 332
- 0
- Timeframe : Daily
GBP/JPY Chart
Are you looking for opportunities in indices and forex?
DISCOVER LONDINIA OPPORTUNITIES...
DISCOVER LONDINIA OPPORTUNITIES...
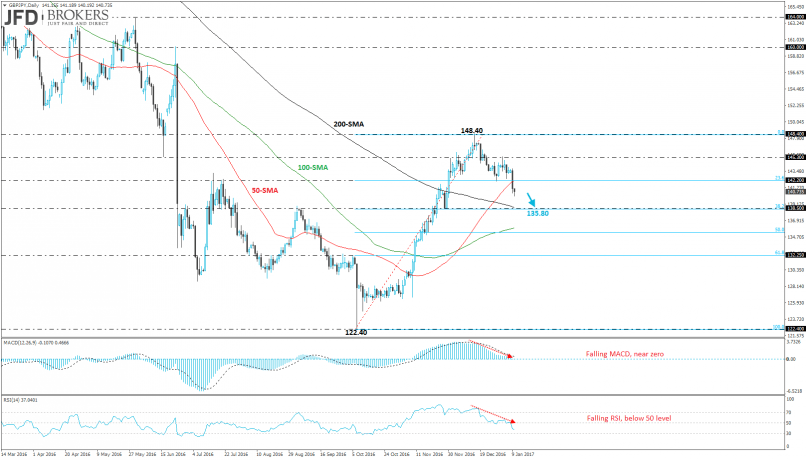
Sterling plunged more than 2% since yesterday against the Japanese yen and started a downward movement following the bounce off the 148.40 resistance level. During Monday’s session, the GBP/JPY pair dropped below the 142.20 barrier and the 50-daily SMA while it is approaching the 138.50 support level which overlaps with the 200-daily SMA and also is overlapping with the Fibonacci retracement level 38.2% of the last upward move (October 2016 low and December 2016 high).
Technical indicators on the daily chart are biased lower after the bearish movement on price. The MACD oscillator is moving below its trigger line suggesting a weaker pair in the next few sessions. In addition, the Relative Strength Index (RSI) is following a downward path below 50, confirming the recent bearish attitude of the price.
Technical indicators on the daily chart are biased lower after the bearish movement on price. The MACD oscillator is moving below its trigger line suggesting a weaker pair in the next few sessions. In addition, the Relative Strength Index (RSI) is following a downward path below 50, confirming the recent bearish attitude of the price.
This member did not declare if he had a position on this financial instrument or a related financial instrument.
About author

Offline


Add a comment
Comments
0 comments on the analysis GBP/JPY - Daily