GBP/JPY - Holds in a Range - Completing Five Red Weeks - 06/08/2017 (GMT)
- Who voted?
- 277
- 0
- Timeframe : Daily
GBP/JPY Chart
Are you looking for opportunities in indices and forex?
DISCOVER LONDINIA OPPORTUNITIES...
DISCOVER LONDINIA OPPORTUNITIES...
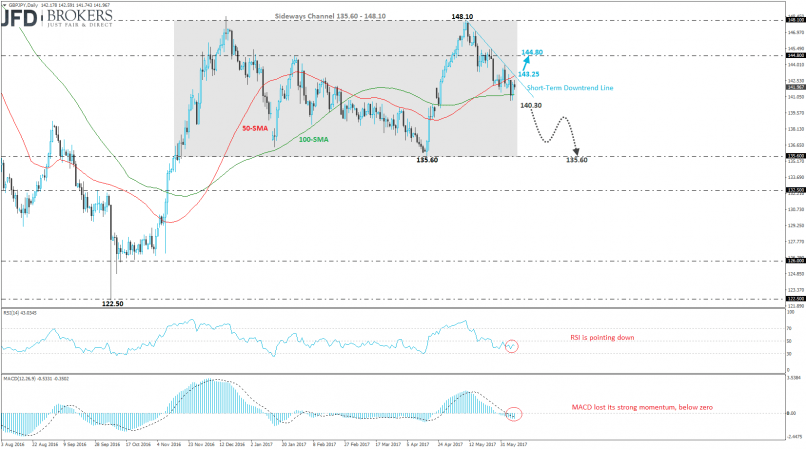
The ninja pair is trading fairly directionless over the last seven months and now is posting the fifth negative week in a row. On a weekly timeframe, the GBP/JPY pair is moving within a sideways channel with upper boundary the 148.10 resistance level and lower boundary the 135.60 support area.
Going to a short-term chart, the pair plunged more than 3.5% since May 10th following the bounce off the 148.10 strong barrier. Currently, the price is developing within the 50 and 100 SMAs and our forecast is a strong volatile move after the announcement of the new U.K. Prime Minister. A drop to the south below the 100-SMA will drive the pair towards the 135.60 obstacle. Otherwise, the price will jump above the short-term falling trend line which coincides with the 50-SMA and will hit the 144.80 resistance handle. RSI indicator is sloping to the downside whilst the MACD oscillator is moving below its trigger line, both with weak momentum.
Going to a short-term chart, the pair plunged more than 3.5% since May 10th following the bounce off the 148.10 strong barrier. Currently, the price is developing within the 50 and 100 SMAs and our forecast is a strong volatile move after the announcement of the new U.K. Prime Minister. A drop to the south below the 100-SMA will drive the pair towards the 135.60 obstacle. Otherwise, the price will jump above the short-term falling trend line which coincides with the 50-SMA and will hit the 144.80 resistance handle. RSI indicator is sloping to the downside whilst the MACD oscillator is moving below its trigger line, both with weak momentum.
This member did not declare if he had a position on this financial instrument or a related financial instrument.
About author

Offline


Add a comment
Comments
0 comments on the analysis GBP/JPY - Daily