GBP/JPY - Will GBP/JPY Find An Obstacle on 50-day SMA? - 06/26/2017 (GMT)
- Who voted?
- 397
- 0
- Timeframe : Daily
GBP/JPY Chart
Are you looking for opportunities in indices and forex?
DISCOVER LONDINIA OPPORTUNITIES...
DISCOVER LONDINIA OPPORTUNITIES...
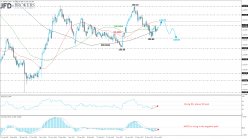
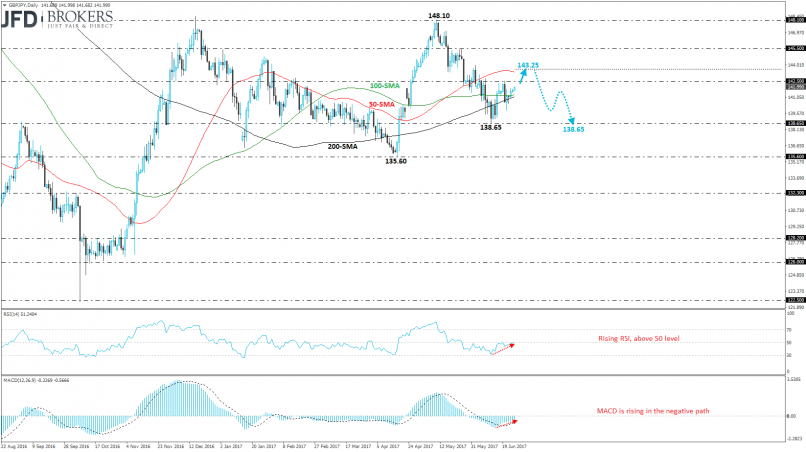
Sterling moved choppily against the Japanese yen over the last two weekly sessions, however, it completed positive periods. The GBP/JPY pair is on track to snap for the second consecutive week the fifth losing candle. Also, the price rebounded on the 138.65 strong support level which overlaps with the 50-week SMA.
The technical structure suggests further rising but slightly above the 142.50 resistance level, there is a significant obstacle the 50-day SMA. Our expectation is a hit of the latter level and then a retracement until the 138.65 support barrier. The RSI indicator is confirming the recent incline as it is inserting the bullish area. Moreover, the MACD oscillator created an upward crossover with its trigger line in the previous sessions and is ready to climb above the zero line.
The technical structure suggests further rising but slightly above the 142.50 resistance level, there is a significant obstacle the 50-day SMA. Our expectation is a hit of the latter level and then a retracement until the 138.65 support barrier. The RSI indicator is confirming the recent incline as it is inserting the bullish area. Moreover, the MACD oscillator created an upward crossover with its trigger line in the previous sessions and is ready to climb above the zero line.
This member did not declare if he had a position on this financial instrument or a related financial instrument.
About author

Offline


Add a comment
Comments
0 comments on the analysis GBP/JPY - Daily