GBP/JPY - Is Holding Within an Ascending Triangle Since April - 07/26/2017 (GMT)
- Who voted?
- 383
- 0
- Timeframe : Daily
GBP/JPY Chart
Are you looking for opportunities in indices and forex?
DISCOVER LONDINIA OPPORTUNITIES...
DISCOVER LONDINIA OPPORTUNITIES...
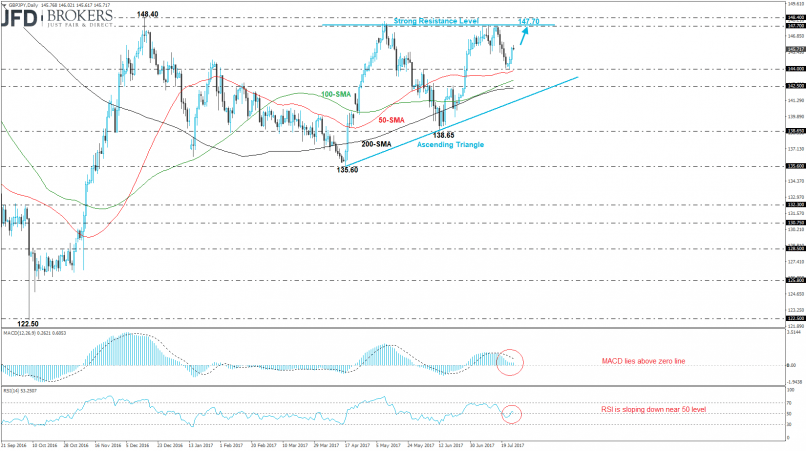
Sterling has been developing within an upward sloping triangle against the Japanese yen over the last four months with significant resistance level at 147.70. The GBP/JPY pair completed the third green day in a row following the pullback on the psychological level 144.00 which is near with the 50-day SMA. Our expectation is a further incline move until the 147.70 – 148.40 resistance zone. The technical indicators are moving near its neutral area with weak momentum. The MACD oscillator lies near the zero line and below its trigger line. Also, the RSI indicator is sloping down in the positive path.
This member did not declare if he had a position on this financial instrument or a related financial instrument.
About author

Offline


Add a comment
Comments
0 comments on the analysis GBP/JPY - Daily