GBP/JPY - Rose More Than 1% - Bullish Movement Is Expected - 11/02/2017 (GMT)
- Who voted?
- 433
- 1
- Timeframe : Daily
GBP/JPY Chart
Are you looking for opportunities in indices and forex?
DISCOVER LONDINIA OPPORTUNITIES...
DISCOVER LONDINIA OPPORTUNITIES...
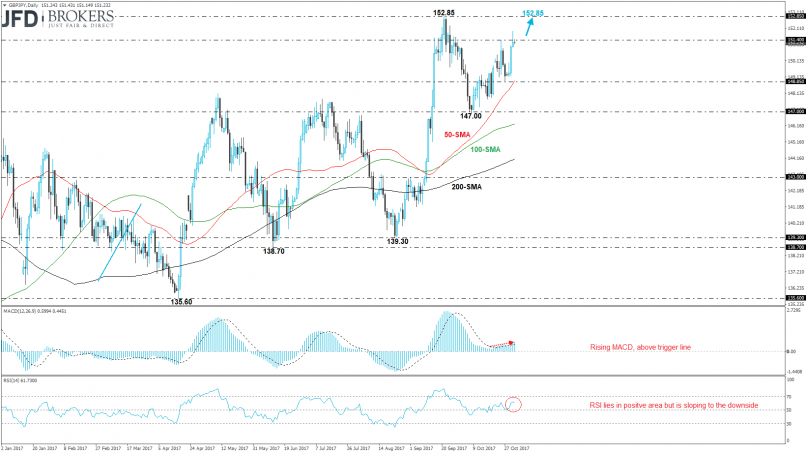
The British Pound was moving sharply to the upside during the previous couple of days versus the Japanese yen, surging more than 1%. The GBP/JPY pair posted three consecutive positive days and jumped to a five-week high at 151.93. The strong bounce off the 148.85 support level, which overlaps with the 50-day SMA is pushing the pair higher towards the 152.85 resistance level.
Technically, on the monthly chart, the price climbed above the 200-SMA and on the daily timeframe the three simple moving averages (50, 100 and 200) are sloping to the upside signaling for more bullish movement. Remaining on the short-term chart, the MACD oscillator is rising with stable movement and the RSI indicator holds in the positive path but is sloping to the downside.
Technically, on the monthly chart, the price climbed above the 200-SMA and on the daily timeframe the three simple moving averages (50, 100 and 200) are sloping to the upside signaling for more bullish movement. Remaining on the short-term chart, the MACD oscillator is rising with stable movement and the RSI indicator holds in the positive path but is sloping to the downside.
This member declared not having a position on this financial instrument or a related financial instrument.
About author

Offline


Add a comment
Comments
1 comments on the analysis GBP/JPY - Daily