GBP/NOK - Is Recording Another Bearish Week - Could Be Ready For a Pullback - 08/25/2017 (GMT)
- Who voted?
- 439
- 0
- Timeframe : Daily
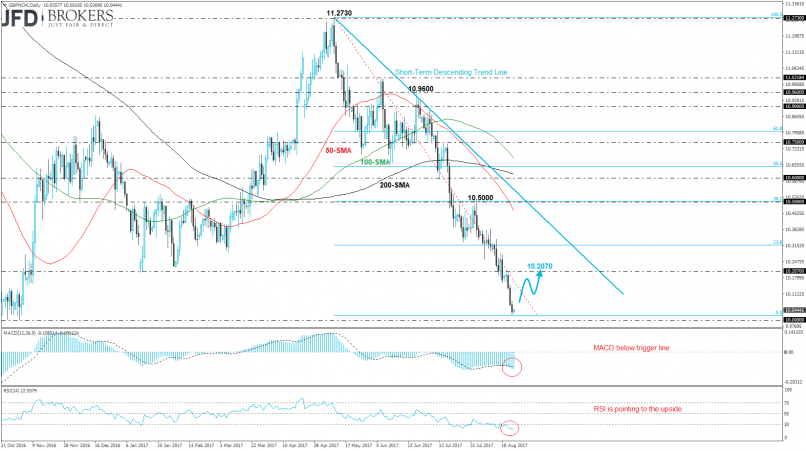
GBP/NOK Chart
Are you looking for opportunities in indices and forex?
DISCOVER LONDINIA OPPORTUNITIES...
DISCOVER LONDINIA OPPORTUNITIES...
The British pound plummeted down to 10.0234, a nine-month low, versus the Norwegian Krone and lost momentum as it is completing the second bearish month in a row. The GBP/NOK pair suffered sharp sell-off since May as it dropped almost 10%. However, our expectation is an attempt to recover some of the losing ground until the 10.2070 support level. On the other side, in case of a break below the 10.0000 strong psychological level will open the door for the 9.6215 support level.
On the daily chart, the price continues developing well below its moving averages, whilst the technical indicators hold within the negative territory. The MACD oscillator dropped below its trigger and zero lines, while the RSI indicator is signaling for an upward retracement as it started a north slope.
On the daily chart, the price continues developing well below its moving averages, whilst the technical indicators hold within the negative territory. The MACD oscillator dropped below its trigger and zero lines, while the RSI indicator is signaling for an upward retracement as it started a north slope.
This member did not declare if he had a position on this financial instrument or a related financial instrument.
About author

Offline


Add a comment
Comments
0 comments on the analysis GBP/NOK - Daily