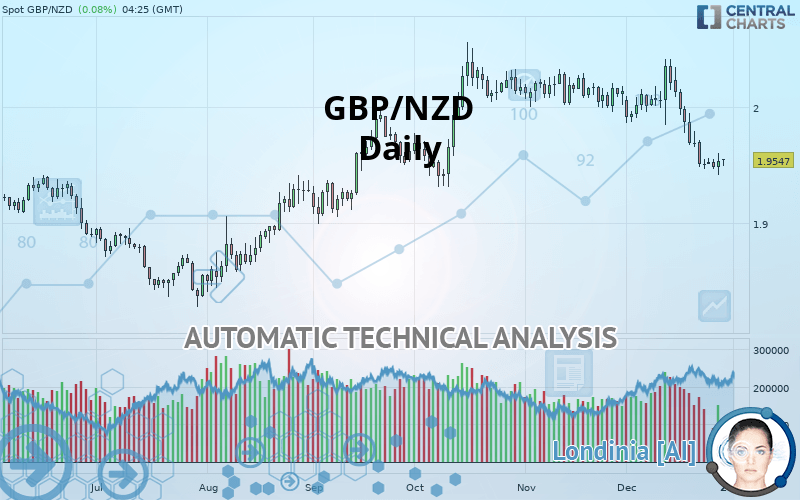
GBP/NZD - Daily - Technical analysis published on 12/30/2019 (GMT)
- Who voted?
- 253
- 0
Click here for a new analysis!
- Timeframe : Daily
- - Analysis generated on
- Status : INVALID

Summary of the analysis

Additional analysis
Quotes
GBP/NZD rating 1.9547 NZD. The price has increased by +0.08% since the last closing and was between 1.9489 NZD and 1.9554 NZD. This implies that the price is at +0.30% from its lowest and at -0.04% from its highest.A bearish opening was detected by the Central Gaps scanner. Sellers are trying to impose a bearish trend in the very short term.
Bearish opening
Type : Bearish
Timeframe : Openning
Here is a more detailed summary of the historical variations registered by GBP/NZD:
Abnormal volumes
Timeframe : 5 days
Abnormal volumes
Timeframe : 20 days
Technical
A technical analysis in Daily of this GBP/NZD chart shows a bearish trend. 71.43% of the signals given by moving averages are bearish. This bearish trend is supported by the strong bearish signals given by short-term moving averages. An assessment of moving averages reveals several bullish signals that could impact this trend:
Bullish price crossover with Moving Average 20
Type : Bullish
Timeframe : Daily
Bullish price crossover with Moving Average 50
Type : Bullish
Timeframe : Daily
Bullish price crossover with Moving Average 100
Type : Bullish
Timeframe : Daily
Bullish price crossover with adaptative moving average 20
Type : Bullish
Timeframe : Daily
Bullish price crossover with adaptative moving average 50
Type : Bullish
Timeframe : Daily
Bullish price crossover with adaptative moving average 100
Type : Bullish
Timeframe : Daily
In fact, of the 18 technical indicators analysed by Central Analyzer, 5 are bullish, 6 are neutral and 7 are bearish. Caution: the Central Indicators scanner currently detects an excess:
Previous candle closed under Bollinger bands
Type : Neutral
Timeframe : Daily
Williams %R indicator is overbought : over -20
Type : Neutral
Timeframe : Daily
Pivot points : price is under support 1
Type : Neutral
Timeframe : Daily
RSI indicator is back over 50
Type : Bullish
Timeframe : Daily
Parabolic SAR indicator bullish reversal
Type : Bullish
Timeframe : Daily
Aroon indicator bullish trend
Type : Bullish
Timeframe : Daily
SuperTrend indicator bullish reversal
Type : Bullish
Timeframe : Daily
Williams %R indicator is back over -50
Type : Bullish
Timeframe : Daily
Central Patterns, the market scanner focusing on chart patterns, resistances and supports found this result:
Near support of channel
Type : Bullish
Timeframe : Daily
There is also a Japanese candlestick pattern detected by Central Candlesticks that could mark the end of the current short-term trend:
Doji
Type : Neutral
Timeframe : Daily
| S3 | S2 | S1 | Price | R1 | R2 | R3 | |
|---|---|---|---|---|---|---|---|
| ProTrendLines | 1.8938 | 1.9112 | 1.9397 | 1.9547 | 1.9813 | 2.0113 | 2.0419 |
| Change (%) | -3.12% | -2.23% | -0.77% | - | +1.36% | +2.90% | +4.46% |
| Change | -0.0609 | -0.0435 | -0.0150 | - | +0.0266 | +0.0566 | +0.0872 |
| Level | Major | Minor | Major | - | Major | Minor | Major |
Attention could also be paid to pivot points to set price objectives:
| Pivot points | S3 | S2 | S1 | PP | R1 | R2 | R3 |
|---|---|---|---|---|---|---|---|
| Standard | 1.8574 | 1.8995 | 1.9574 | 1.9995 | 2.0574 | 2.0995 | 2.1574 |
| Camarilla | 1.9877 | 1.9969 | 2.0060 | 2.0152 | 2.0244 | 2.0335 | 2.0427 |
| Woodie | 1.8652 | 1.9035 | 1.9652 | 2.0035 | 2.0652 | 2.1035 | 2.1652 |
| Fibonacci | 1.8995 | 1.9377 | 1.9613 | 1.9995 | 2.0377 | 2.0613 | 2.0995 |
| Pivot points | S3 | S2 | S1 | PP | R1 | R2 | R3 |
|---|---|---|---|---|---|---|---|
| Standard | 1.7612 | 1.8226 | 1.9189 | 1.9803 | 2.0766 | 2.1380 | 2.2343 |
| Camarilla | 1.9718 | 1.9863 | 2.0007 | 2.0152 | 2.0297 | 2.0441 | 2.0586 |
| Woodie | 1.7787 | 1.8313 | 1.9364 | 1.9890 | 2.0941 | 2.1467 | 2.2518 |
| Fibonacci | 1.8226 | 1.8828 | 1.9201 | 1.9803 | 2.0405 | 2.0778 | 2.1380 |
| Pivot points | S3 | S2 | S1 | PP | R1 | R2 | R3 |
|---|---|---|---|---|---|---|---|
| Standard | 1.8160 | 1.8789 | 1.9160 | 1.9789 | 2.0160 | 2.0789 | 2.1160 |
| Camarilla | 1.9257 | 1.9349 | 1.9440 | 1.9532 | 1.9624 | 1.9715 | 1.9807 |
| Woodie | 1.8032 | 1.8725 | 1.9032 | 1.9725 | 2.0032 | 2.0725 | 2.1032 |
| Fibonacci | 1.8789 | 1.9171 | 1.9407 | 1.9789 | 2.0171 | 2.0407 | 2.0789 |
Numerical data
The following is the status of the technical indicators and moving averages at the time of publication of this technical analysis:
| RSI (14): | 45.70 | |
| MACD (12,26,9): | -0.0145 | |
| Directional Movement: | 11.9622 | |
| AROON (14): | 7.1428 | |
| DEMA (21): | 1.9567 | |
| Parabolic SAR (0,02-0,02-0,2): | 1.8840 | |
| Elder Ray (13): | -0.0141 | |
| Super Trend (3,10): | 1.8837 | |
| Zig ZAG (10): | 1.9538 | |
| VORTEX (21): | 0.8191 | |
| Stochastique (14,3,5): | 43.58 | |
| TEMA (21): | 1.9459 | |
| Williams %R (14): | -55.74 | |
| Chande Momentum Oscillator (20): | -0.0592 | |
| Repulse (5,40,3): | 0.9506 | |
| ROCnROLL: | 2 | |
| TRIX (15,9): | -0.0935 | |
| Courbe Coppock: | 5.63 |
| MA7: | 1.9519 | |
| MA20: | 1.9819 | |
| MA50: | 2.0009 | |
| MA100: | 1.9770 | |
| MAexp7: | 1.9590 | |
| MAexp20: | 1.9744 | |
| MAexp50: | 1.9853 | |
| MAexp100: | 1.9745 | |
| Price / MA7: | +0.14% | |
| Price / MA20: | -1.37% | |
| Price / MA50: | -2.31% | |
| Price / MA100: | -1.13% | |
| Price / MAexp7: | -0.22% | |
| Price / MAexp20: | -1.00% | |
| Price / MAexp50: | -1.54% | |
| Price / MAexp100: | -1.00% |
News
Don"t forget to follow the news on GBP/NZD. At the time of publication of this analysis, the latest news was as follows:
-
 Why I'm looking to buy GBPNZD: Coleman
-
Why I'm looking to buy GBPNZD: Coleman
-
GBP/NZD: Pound Has Upperhand
-
Forex Trading Video: GBP/NZD The Cross Roads of BoE and RBNZ, Dollar Faces Wave of Data
-
Forex Strategy Video: Time Frame Matters on Entry from Themes Like Risk Trends to GBPNZD
About author

Online


Add a comment
Comments
0 comments on the analysis GBP/NZD - Daily