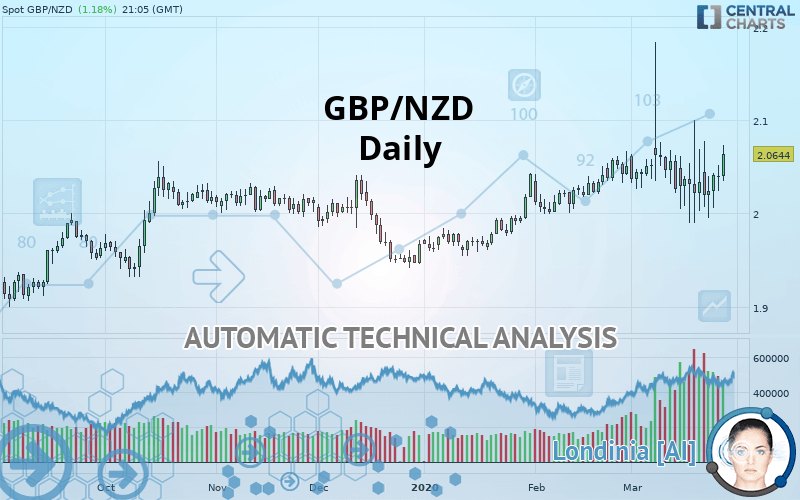
GBP/NZD - Daily - Technical analysis published on 03/28/2020 (GMT)
- Who voted?
- 277
- 0
Click here for a new analysis!
- Timeframe : Daily
- - Analysis generated on
- Status : LEVEL MAINTAINED

Summary of the analysis

Additional analysis
Quotes
The GBP/NZD price is 2.0644 NZD. The price has increased by +1.18% since the last closing and was traded between 2.0349 NZD and 2.0738 NZD over the period. The price is currently at +1.45% from its lowest and -0.45% from its highest.So that you have an overall view of the price change, here is a table showing the variations over several periods:
Near a new LOW record (1st january)
Type : Bearish
Timeframe : Weekly
Near a new LOW record (1 month)
Type : Bearish
Timeframe : Weekly
Abnormal volumes on GBP/NZD were detected by the Central Volumes scanner:
Abnormal volumes
Timeframe : 5 days
Abnormal volumes
Timeframe : 20 days
Technical
Technical analysis of this Daily chart of GBP/NZD indicates that the overall trend is strongly bullish. 92.86% of the signals given by moving averages are bullish. This strongly bullish trend is supported by the strong bullish signals given by short-term moving averages. The Central Indicators scanner detects a bearish signal on moving averages that could impact this trend:
Bearish price crossover with Moving Average 20
Type : Bearish
Timeframe : Daily
An assessment of technical indicators shows a moderate bullish signal.
Caution: the Central Indicators scanner currently detects an excess:
Williams %R indicator is overbought : over -20
Type : Neutral
Timeframe : Daily
Pivot points : price is over resistance 1
Type : Neutral
Timeframe : Daily
Price is back under the pivot point
Type : Bearish
Timeframe : Weekly
The Central Patterns scanner, which studies chart patterns, resistances and supports, has identified these signals:
Horizontal resistance is broken
Type : Bullish
Timeframe : Daily
Support of channel is broken
Type : Bearish
Timeframe : Daily
Central Candlesticks, the scanner specialised in Japanese candlesticks, detects these signals that could have an impact on the current short-term trend:
Bearish harami
Type : Bearish
Timeframe : Daily
Doji
Type : Neutral
Timeframe : Daily
| S3 | S2 | S1 | Price | R1 | R2 | R3 | |
|---|---|---|---|---|---|---|---|
| ProTrendLines | 1.9472 | 1.9813 | 2.0419 | 2.0644 | 2.2327 | 2.4519 | 2.8856 |
| Change (%) | -5.68% | -4.03% | -1.09% | - | +8.15% | +18.77% | +39.78% |
| Change | -0.1172 | -0.0831 | -0.0225 | - | +0.1683 | +0.3875 | +0.8212 |
| Level | Minor | Major | Major | - | Minor | Intermediate | Intermediate |
Attention could also be paid to pivot points to set price objectives:
| Pivot points | S3 | S2 | S1 | PP | R1 | R2 | R3 |
|---|---|---|---|---|---|---|---|
| Standard | 1.9981 | 2.0112 | 2.0258 | 2.0389 | 2.0535 | 2.0666 | 2.0812 |
| Camarilla | 2.0327 | 2.0352 | 2.0378 | 2.0403 | 2.0428 | 2.0454 | 2.0479 |
| Woodie | 1.9988 | 2.0116 | 2.0265 | 2.0393 | 2.0542 | 2.0670 | 2.0819 |
| Fibonacci | 2.0112 | 2.0218 | 2.0284 | 2.0389 | 2.0495 | 2.0561 | 2.0666 |
| Pivot points | S3 | S2 | S1 | PP | R1 | R2 | R3 |
|---|---|---|---|---|---|---|---|
| Standard | 1.8710 | 1.9303 | 1.9823 | 2.0416 | 2.0936 | 2.1529 | 2.2049 |
| Camarilla | 2.0037 | 2.0139 | 2.0241 | 2.0343 | 2.0445 | 2.0547 | 2.0649 |
| Woodie | 1.8674 | 1.9285 | 1.9787 | 2.0398 | 2.0900 | 2.1511 | 2.2013 |
| Fibonacci | 1.9303 | 1.9728 | 1.9991 | 2.0416 | 2.0841 | 2.1104 | 2.1529 |
| Pivot points | S3 | S2 | S1 | PP | R1 | R2 | R3 |
|---|---|---|---|---|---|---|---|
| Standard | 1.9435 | 1.9715 | 2.0113 | 2.0393 | 2.0791 | 2.1071 | 2.1469 |
| Camarilla | 2.0324 | 2.0386 | 2.0448 | 2.0510 | 2.0572 | 2.0634 | 2.0696 |
| Woodie | 1.9493 | 1.9745 | 2.0171 | 2.0423 | 2.0849 | 2.1101 | 2.1527 |
| Fibonacci | 1.9715 | 1.9974 | 2.0134 | 2.0393 | 2.0652 | 2.0812 | 2.1071 |
Numerical data
The following are the details of the technical indicators and moving averages that were collected to generate this technical analysis:
| RSI (14): | 60.62 | |
| MACD (12,26,9): | 0.0033 | |
| Directional Movement: | 14.1689 | |
| AROON (14): | -50.0000 | |
| DEMA (21): | 2.0434 | |
| Parabolic SAR (0,02-0,02-0,2): | 2.0819 | |
| Elder Ray (13): | 0.0150 | |
| Super Trend (3,10): | 2.0109 | |
| Zig ZAG (10): | 2.0644 | |
| VORTEX (21): | 1.0018 | |
| Stochastique (14,3,5): | 39.86 | |
| TEMA (21): | 2.0393 | |
| Williams %R (14): | -32.79 | |
| Chande Momentum Oscillator (20): | 0.0182 | |
| Repulse (5,40,3): | 1.7891 | |
| ROCnROLL: | 1 | |
| TRIX (15,9): | 0.0235 | |
| Courbe Coppock: | 1.32 |
| MA7: | 2.0350 | |
| MA20: | 2.0411 | |
| MA50: | 2.0261 | |
| MA100: | 2.0080 | |
| MAexp7: | 2.0416 | |
| MAexp20: | 2.0381 | |
| MAexp50: | 2.0267 | |
| MAexp100: | 2.0099 | |
| Price / MA7: | +1.44% | |
| Price / MA20: | +1.14% | |
| Price / MA50: | +1.89% | |
| Price / MA100: | +2.81% | |
| Price / MAexp7: | +1.12% | |
| Price / MAexp20: | +1.29% | |
| Price / MAexp50: | +1.86% | |
| Price / MAexp100: | +2.71% |
News
The last news published on GBP/NZD at the time of the generation of this analysis was as follows:
-
 Why I'm looking to buy GBPNZD: Coleman
-
Why I'm looking to buy GBPNZD: Coleman
-
GBP/NZD: Pound Has Upperhand
-
Forex Trading Video: GBP/NZD The Cross Roads of BoE and RBNZ, Dollar Faces Wave of Data
-
Forex Strategy Video: Time Frame Matters on Entry from Themes Like Risk Trends to GBPNZD
About author

Online


Add a comment
Comments
0 comments on the analysis GBP/NZD - Daily