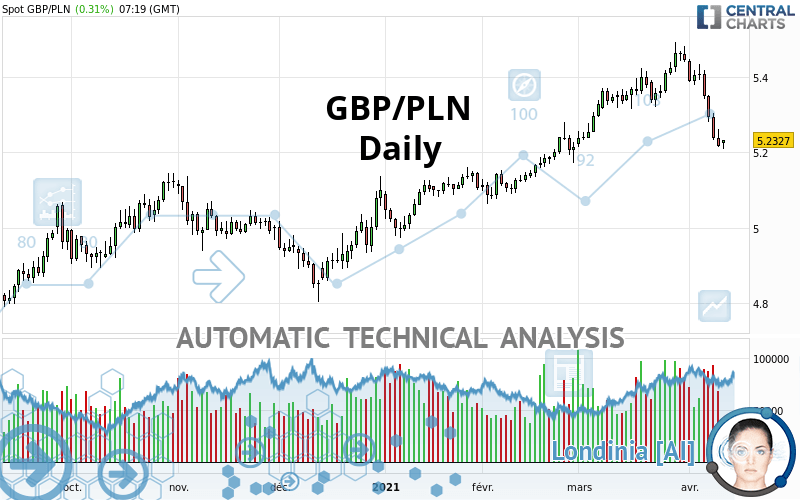
GBP/PLN - Daily - Technical analysis published on 04/12/2021 (GMT)
- 238
- 0
Click here for a new analysis!
- Timeframe : Daily
- - Analysis generated on
- Status : LEVEL MAINTAINED

Summary of the analysis

Additional analysis
Quotes
The GBP/PLN rating is 5.2327 PLN. The price has increased by +0.31% since the last closing with the lowest point at 5.2073 PLN and the highest point at 5.2331 PLN. The deviation from the price is +0.49% for the low point and -0.01% for the high point.A bullish opening was detected by the Central Gaps scanner. Buyers are trying to impose a bullish momentum in the very short term.
Bullish opening
Type : Bullish
Timeframe : Openning
Here is a more detailed summary of the historical variations registered by GBP/PLN:
Near a new LOW record (1st january)
Type : Bearish
Timeframe : Weekly
Technical
Technical analysis of GBP/PLN in Daily shows an overall slightly bullish trend. 57.14% of the signals given by moving averages are bullish. Caution: a reversal of the trend could be possible given the strong bearish signals of short-term moving averages. The Central Indicators market scanner is currently detecting a bearish signal that could impact this trend:
Bearish price crossover with adaptative moving average 100
Type : Bearish
Timeframe : Daily
In fact, 11 technical indicators on 18 studied are currently positioned bearish. Caution: the Central Indicators scanner currently detects an excess:
CCI indicator is oversold : under -100
Type : Neutral
Timeframe : Daily
Previous candle closed under Bollinger bands
Type : Neutral
Timeframe : Daily
MACD indicator: bearish divergence
Type : Bearish
Timeframe : Daily
RSI indicator: bearish divergence
Type : Bearish
Timeframe : Daily
Williams %R indicator is oversold : under -80
Type : Neutral
Timeframe : Daily
Pivot points : price is over resistance 2
Type : Neutral
Timeframe : Weekly
Pivot points : price is over resistance 3
Type : Neutral
Timeframe : Daily
Pivot points : price is under support 3
Type : Neutral
Timeframe : Daily
Pivot points : price is under support 3
Type : Neutral
Timeframe : Weekly
Ichimoku - Bearish crossover : Tenkan & Kijun
Type : Bearish
Timeframe : Daily
The Central Patterns scanner, which studies chart patterns, resistances and supports, has identified these signals:
Near horizontal support
Type : Bullish
Timeframe : Daily
Support of channel is broken
Type : Bearish
Timeframe : Daily
No result was found by the Central Candlesticks scanner on Japanese candlesticks.
| S3 | S2 | S1 | Price | R1 | R2 | R3 | |
|---|---|---|---|---|---|---|---|
| ProTrendLines | 4.9793 | 5.1209 | 5.2231 | 5.2327 | 5.3376 | 5.3982 | 5.4950 |
| Change (%) | -4.84% | -2.14% | -0.18% | - | +2.00% | +3.16% | +5.01% |
| Change | -0.2534 | -0.1118 | -0.0096 | - | +0.1049 | +0.1655 | +0.2623 |
| Level | Major | Intermediate | Major | - | Minor | Minor | Major |
Attention could also be paid to pivot points to set price objectives:
| Pivot points | S3 | S2 | S1 | PP | R1 | R2 | R3 |
|---|---|---|---|---|---|---|---|
| Standard | 5.1504 | 5.1821 | 5.1993 | 5.2310 | 5.2482 | 5.2799 | 5.2971 |
| Camarilla | 5.2032 | 5.2076 | 5.2121 | 5.2166 | 5.2211 | 5.2256 | 5.2301 |
| Woodie | 5.1433 | 5.1785 | 5.1922 | 5.2274 | 5.2411 | 5.2763 | 5.2900 |
| Fibonacci | 5.1821 | 5.2008 | 5.2123 | 5.2310 | 5.2497 | 5.2612 | 5.2799 |
| Pivot points | S3 | S2 | S1 | PP | R1 | R2 | R3 |
|---|---|---|---|---|---|---|---|
| Standard | 4.9226 | 5.0681 | 5.1424 | 5.2879 | 5.3622 | 5.5077 | 5.5820 |
| Camarilla | 5.1562 | 5.1763 | 5.1965 | 5.2166 | 5.2368 | 5.2569 | 5.2771 |
| Woodie | 4.8869 | 5.0503 | 5.1067 | 5.2701 | 5.3265 | 5.4899 | 5.5463 |
| Fibonacci | 5.0681 | 5.1521 | 5.2040 | 5.2879 | 5.3719 | 5.4238 | 5.5077 |
| Pivot points | S3 | S2 | S1 | PP | R1 | R2 | R3 |
|---|---|---|---|---|---|---|---|
| Standard | 4.9957 | 5.1046 | 5.2740 | 5.3829 | 5.5523 | 5.6612 | 5.8306 |
| Camarilla | 5.3669 | 5.3924 | 5.4179 | 5.4434 | 5.4689 | 5.4944 | 5.5199 |
| Woodie | 5.0260 | 5.1197 | 5.3043 | 5.3980 | 5.5826 | 5.6763 | 5.8609 |
| Fibonacci | 5.1046 | 5.2109 | 5.2766 | 5.3829 | 5.4892 | 5.5549 | 5.6612 |
Numerical data
The following are the details of the technical indicators and moving averages that were collected to generate this technical analysis:
| RSI (14): | 35.36 | |
| MACD (12,26,9): | -0.0069 | |
| Directional Movement: | -14.3748 | |
| AROON (14): | -71.4286 | |
| DEMA (21): | 5.3371 | |
| Parabolic SAR (0,02-0,02-0,2): | 5.4454 | |
| Elder Ray (13): | -0.1032 | |
| Super Trend (3,10): | 5.3669 | |
| Zig ZAG (10): | 5.2226 | |
| VORTEX (21): | 0.8856 | |
| Stochastique (14,3,5): | 2.38 | |
| TEMA (21): | 5.2870 | |
| Williams %R (14): | -96.66 | |
| Chande Momentum Oscillator (20): | -0.1927 | |
| Repulse (5,40,3): | -2.0382 | |
| ROCnROLL: | 2 | |
| TRIX (15,9): | 0.0725 | |
| Courbe Coppock: | 2.77 |
| MA7: | 5.3040 | |
| MA20: | 5.3640 | |
| MA50: | 5.2738 | |
| MA100: | 5.1434 | |
| MAexp7: | 5.2852 | |
| MAexp20: | 5.3291 | |
| MAexp50: | 5.2774 | |
| MAexp100: | 5.1930 | |
| Price / MA7: | -1.34% | |
| Price / MA20: | -2.45% | |
| Price / MA50: | -0.78% | |
| Price / MA100: | +1.74% | |
| Price / MAexp7: | -0.99% | |
| Price / MAexp20: | -1.81% | |
| Price / MAexp50: | -0.85% | |
| Price / MAexp100: | +0.76% |
About author

Online


Add a comment
Comments
0 comments on the analysis GBP/PLN - Daily