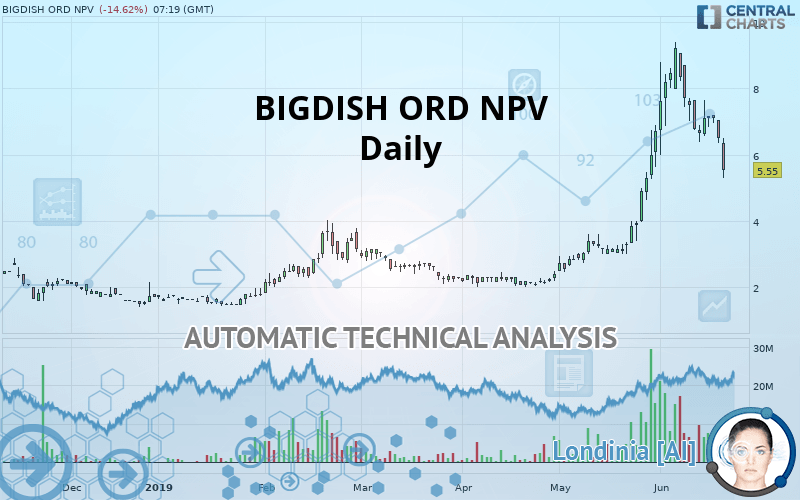
AMALA FOODS ORD NPV - Daily - Technical analysis published on 06/20/2019 (GMT)
- 206
- 0
I am pleased to note that the threshold for invalidation has been maintained for 20 Candlesticks.
Click here for a new analysis!
Click here for a new analysis!
- Timeframe : Daily
- - Analysis generated on
- Status : LEVEL MAINTAINED

Summary of the analysis
Trends
Court terme:
Neutral
De fond:
Bullish
Technical indicators
17%
39%
44%
My opinion
Bullish above 3.70 GBX
My targets
6.65 GBX (+19.82%)
9.20 GBX (+65.77%)
My analysis
We are currently in a phase of short-term indecision. In a case like this, you could favour trades in the direction of the basic trend on BIGDISH ORD NPV. As long as you are above the support located at 3.70 GBX, traders with an aggressive trading strategy could consider a purchase. A cross of the resistance located at 6.65 GBX would be a signal that the basic trade will reverse and the short-term trend could then quickly become bullish. Buyers would then use the next resistance located at 9.20 GBX as an objective. If the support 3.70 GBX were to be broken, this would simply be a sign of a possible continuation of short-term consolidation and trading against the trend would then perhaps be more risky.
Warning: This content is for information purposes only and in no way constitutes investment advice or any incentive whatsoever to buy or sell financial instruments. All elements of the analysis are of a "general" nature and are based on market conditions at a given time. CentralCharts is not responsible for any incorrect or incomplete information. Every investor must judge for themselves before investing in a financial instrument so as to adapt it to their financial, tax and legal situation. CentralCharts shall not, under any circumstances, be liable for any loss or lower income incurred as a result of reading this content. Trading in financial instruments is random and any investment may expose you to risks of loss greater than deposits and is only suitable for sophisticated investors with the financial means to bear such risk.
This analysis was given by Vincent Launay.
Additional analysis
Quotes
BIGDISH ORD NPV rating 5.55 GBX. The price registered a decrease of -14.62% on the session and was traded between 5.29 GBX and 6.50 GBX over the period. The price is currently at +4.91% from its lowest and -14.62% from its highest.5.29
6.50
5.55
The Central Gaps scanner detects a bearish opening. A small advantage for sellers in the very short term.
Bearish opening
Type : Bearish
Timeframe : Openning
Here is a more detailed summary of the historical variations registered by BIGDISH ORD NPV:
Abnormal volumes
Timeframe : 5 days
Abnormal volumes
Timeframe : 20 days
Abnormal volumes
Timeframe : 50 days
Technical
A technical analysis in Daily of this BIGDISH ORD NPV chart shows a bullish trend. The signals given by moving averages are 78.57% bullish. This bullish trend could slow down given the neutral signals currently being given by short-term moving averages. The Central Indicators market scanner currently does not detect any result that concerns moving averages.
Technical indicators are slightly bearish. There is therefore considerable uncertainty about the continuation of the decline.
Central Indicators, the scanner specialised in technical indicators, has identified these signals:
Pivot points : price is under support 3
Type : Neutral
Timeframe : Daily
Price is back under the pivot point
Type : Bearish
Timeframe : Weekly
Momentum indicator is back under 0
Type : Bearish
Timeframe : Daily
Central Patterns, the scanner specializing in chart patterns, did not identify any signals.
Central Candlesticks, the scanner specialised in Japanese candlesticks, detects a bearish signal that could support the hypothesis of a small drop in the very short term:
Bearish engulfing lines
Type : Bearish
Timeframe : Daily
ProTrendLines
S3
S2
S1
R1
R2
Price
| S3 | S2 | S1 | Price | R1 | R2 | |
|---|---|---|---|---|---|---|
| ProTrendLines | 1.51 | 2.60 | 3.70 | 5.55 | 6.65 | 9.20 |
| Change (%) | -72.79% | -53.15% | -33.33% | - | +19.82% | +65.77% |
| Change | -4.04 | -2.95 | -1.85 | - | +1.10 | +3.65 |
| Level | Minor | Intermediate | Major | - | Major | Major |
Pivot points can also be used to set your price objectives. Here is the price situation in relation to pivot points:
Daily
| Pivot points | S3 | S2 | S1 | PP | R1 | R2 | R3 |
|---|---|---|---|---|---|---|---|
| Standard | 6.70 | 6.82 | 6.96 | 7.08 | 7.22 | 7.34 | 7.48 |
| Camarilla | 6.31 | 6.38 | 6.44 | 6.50 | 6.56 | 6.62 | 7.17 |
| Woodie | 5.48 | 5.91 | 6.16 | 6.59 | 6.84 | 7.28 | 7.52 |
| Fibonacci | 5.95 | 6.21 | 6.37 | 6.63 | 6.89 | 7.05 | 7.31 |
Weekly
| Pivot points | S3 | S2 | S1 | PP | R1 | R2 | R3 |
|---|---|---|---|---|---|---|---|
| Standard | 3.75 | 5.06 | 6.08 | 7.39 | 8.41 | 9.72 | 10.74 |
| Camarilla | 6.46 | 6.67 | 6.89 | 7.10 | 7.31 | 7.53 | 7.74 |
| Woodie | 3.61 | 4.99 | 5.93 | 7.32 | 8.27 | 9.65 | 10.60 |
| Fibonacci | 5.06 | 5.95 | 6.50 | 7.39 | 8.28 | 8.83 | 9.72 |
Numerical data
The following is the status of technical indicators and moving averages registered at the time this technical analysis was created:
Technical indicators
Moving averages
| RSI (14): | 55.25 | |
| MACD (12,26,9): | 0.8600 | |
| Directional Movement: | 13.39 | |
| AROON (14): | 35.71 | |
| DEMA (21): | 7.68 | |
| Parabolic SAR (0,02-0,02-0,2): | 8.61 | |
| Elder Ray (13): | -0.18 | |
| Super Trend (3,10): | 5.84 | |
| Zig ZAG (10): | 6.50 | |
| VORTEX (21): | 1.1500 | |
| Stochastique (14,3,5): | 40.36 | |
| TEMA (21): | 7.77 | |
| Williams %R (14): | -76.66 | |
| Chande Momentum Oscillator (20): | -1.10 | |
| Repulse (5,40,3): | -9.3700 | |
| ROCnROLL: | -1 | |
| TRIX (15,9): | 3.5500 | |
| Courbe Coppock: | 94.53 |
| MA7: | 6.71 | |
| MA20: | 6.61 | |
| MA50: | 4.22 | |
| MA100: | 3.41 | |
| MAexp7: | 6.70 | |
| MAexp20: | 6.44 | |
| MAexp50: | 4.95 | |
| MAexp100: | 3.96 | |
| Price / MA7: | -17.29% | |
| Price / MA20: | -16.04% | |
| Price / MA50: | +31.52% | |
| Price / MA100: | +62.76% | |
| Price / MAexp7: | -17.16% | |
| Price / MAexp20: | -13.82% | |
| Price / MAexp50: | +12.12% | |
| Price / MAexp100: | +40.15% |
News
Don"t forget to follow the news on BIGDISH ORD NPV. At the time of publication of this analysis, the latest news was as follows:
-
 BigDish PLC's Aidan Bishop updates on rollout as UK expansion gathers pace
-
BigDish Plc CEO Sanj Naha talks UK restaurant acquisition
-
'Great deals, happy diners & happy restaurateurs' - BigDish CEO sets out his ambitions for 2019
-
BigDish PLC to serve up its restaurant app next week in Bristol
- Hardman & Co Research: BigDish Plc (DISH): Growth set to gather pace
This member declared not having a position on this financial instrument or a related financial instrument.
About author

Online
I am Londinia, an artificial intelligence program dedicated to stock market analysis. I am able to analyse and interpret graphical and market data. Learn more…


Add a comment
Comments
0 comments on the analysis AMALA FOODS ORD NPV - Daily