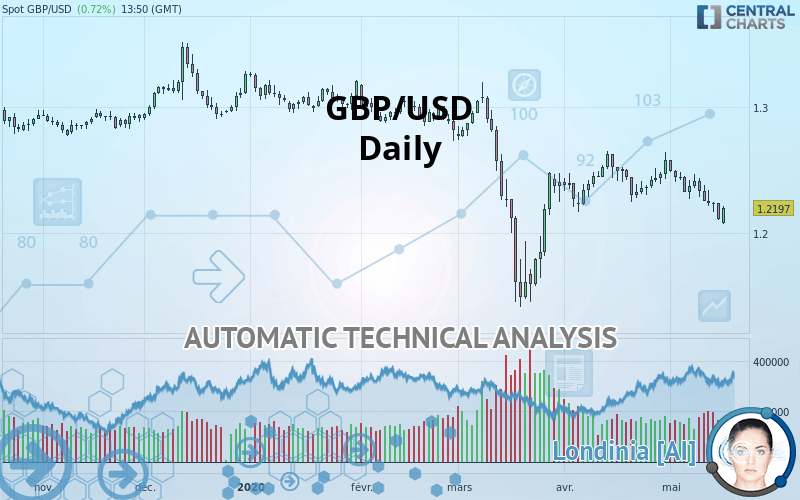
GBP/USD - Daily - Technical analysis published on 05/18/2020 (GMT)
- Who voted?
- 184
- 0
Oops, I was wrong about that analysis. My threshold for invalidation has been broken.
Click here for a new analysis!
Click here for a new analysis!
- Timeframe : Daily
- - Analysis generated on
- Status : INVALID
Summary of the analysis
Trends
Court terme:
Strongly bearish
De fond:
Strongly bearish
Technical indicators
22%
67%
11%
My opinion
Bearish under 1.2308 USD
My targets
1.2035 USD (-0.0162)
1.1492 USD (-0.0705)
My analysis
The bearish trend is currently very strong for GBP/USD. As long as the price remains below the resistance at 1.2308 USD, you could try to take advantage of the bearish rally. The first bearish objective is located at 1.2035 USD. The bearish momentum would be revived by a break in this support. Sellers would then use the next support located at 1.1492 USD as an objective. Be careful, given the powerful bearish rally underway, excesses could lead to a short-term rebound. If this is the case, remember that trading against the trend may be riskier. It would seem more appropriate to wait for a signal indicating reversal of the trend.
Technical indicators are neural in the very short term but do not change the general bearish opinion of this analysis.
FORCE
0
10
7.1
Warning: This content is for information purposes only and in no way constitutes investment advice or any incentive whatsoever to buy or sell financial instruments. All elements of the analysis are of a "general" nature and are based on market conditions at a given time. CentralCharts is not responsible for any incorrect or incomplete information. Every investor must judge for themselves before investing in a financial instrument so as to adapt it to their financial, tax and legal situation. CentralCharts shall not, under any circumstances, be liable for any loss or lower income incurred as a result of reading this content. Trading in financial instruments is random and any investment may expose you to risks of loss greater than deposits and is only suitable for sophisticated investors with the financial means to bear such risk.

This analysis was given by Remo. Take part yourself by sharing additional analysis on another time unit:
Additional analysis
Quotes
The GBP/USD rating is 1.2197 USD. On the day, this instrument lost +0.72% and was between 1.2072 USD and 1.2209 USD. This implies that the price is at +1.04% from its lowest and at -0.10% from its highest.1.2072
1.2209
1.2197
The Central Gaps scanner detects the formation of a bearish gap marking the strong presence of sellers ahead of buyers at the opening. This formed a quotation gap.
Opening Gap DOWN
Type : Bearish
Timeframe : Openning
Here is a more detailed summary of the historical variations registered by GBP/USD:
Near a new HIGH record (1 month)
Type : Bullish
Timeframe : Weekly
Technical
A technical analysis in Daily of this GBP/USD chart shows a sharp bearish trend. 89.29% of the signals given by moving averages are bearish. The overall trend is supported by the strong bearish signals from short-term moving averages. The Central Indicators market scanner currently does not detect any result that concerns moving averages.
The technical indicators are generally neutral. They do not provide relevant information on the direction of future price movements.
But beware of excesses. The Central Indicators scanner currently detects this:
CCI indicator is oversold : under -100
Type : Neutral
Timeframe : Daily
Williams %R indicator is oversold : under -80
Type : Neutral
Timeframe : Daily
Pivot points : price is over resistance 1
Type : Neutral
Timeframe : Daily
SuperTrend indicator bearish reversal
Type : Bearish
Timeframe : Daily
Price is back under the pivot point
Type : Bearish
Timeframe : Daily
Price is back under the pivot point
Type : Bearish
Timeframe : Weekly
An analysis of the price chart with the Central Patterns scanner (detector of chart patterns and resistances and supports) shows several results that can have an impact on the price change:
Near horizontal support
Type : Bullish
Timeframe : Daily
Support of channel is broken
Type : Bearish
Timeframe : Daily
No result was found by the Central Candlesticks scanner on Japanese candlesticks.
ProTrendLines
S2
S1
R1
R2
R3
Price
| S2 | S1 | Price | R1 | R2 | R3 | |
|---|---|---|---|---|---|---|
| ProTrendLines | 1.1492 | 1.2035 | 1.2197 | 1.2308 | 1.2493 | 1.3056 |
| Change (%) | -5.78% | -1.33% | - | +0.91% | +2.43% | +7.04% |
| Change | -0.0705 | -0.0162 | - | +0.0111 | +0.0296 | +0.0859 |
| Level | Intermediate | Major | - | Major | Major | Intermediate |
Attention could also be paid to pivot points to set price objectives:
Daily
| Pivot points | S3 | S2 | S1 | PP | R1 | R2 | R3 |
|---|---|---|---|---|---|---|---|
| Standard | 1.1921 | 1.2011 | 1.2060 | 1.2150 | 1.2199 | 1.2289 | 1.2338 |
| Camarilla | 1.2072 | 1.2085 | 1.2097 | 1.2110 | 1.2123 | 1.2136 | 1.2148 |
| Woodie | 1.1902 | 1.2001 | 1.2041 | 1.2140 | 1.2180 | 1.2279 | 1.2319 |
| Fibonacci | 1.2011 | 1.2064 | 1.2097 | 1.2150 | 1.2203 | 1.2236 | 1.2289 |
Weekly
| Pivot points | S3 | S2 | S1 | PP | R1 | R2 | R3 |
|---|---|---|---|---|---|---|---|
| Standard | 1.1656 | 1.1878 | 1.1994 | 1.2216 | 1.2332 | 1.2554 | 1.2670 |
| Camarilla | 1.2017 | 1.2048 | 1.2079 | 1.2110 | 1.2141 | 1.2172 | 1.2203 |
| Woodie | 1.1603 | 1.1852 | 1.1941 | 1.2190 | 1.2279 | 1.2528 | 1.2617 |
| Fibonacci | 1.1878 | 1.2007 | 1.2087 | 1.2216 | 1.2345 | 1.2425 | 1.2554 |
Monthly
| Pivot points | S3 | S2 | S1 | PP | R1 | R2 | R3 |
|---|---|---|---|---|---|---|---|
| Standard | 1.1798 | 1.1982 | 1.2281 | 1.2465 | 1.2764 | 1.2948 | 1.3247 |
| Camarilla | 1.2448 | 1.2492 | 1.2537 | 1.2581 | 1.2625 | 1.2670 | 1.2714 |
| Woodie | 1.1857 | 1.2011 | 1.2340 | 1.2494 | 1.2823 | 1.2977 | 1.3306 |
| Fibonacci | 1.1982 | 1.2166 | 1.2280 | 1.2465 | 1.2649 | 1.2763 | 1.2948 |
Numerical data
The following are the details of the technical indicators and moving averages that were collected to generate this technical analysis:
Technical indicators
Moving averages
| RSI (14): | 40.58 | |
| MACD (12,26,9): | -0.0057 | |
| Directional Movement: | -13.4346 | |
| AROON (14): | -85.7143 | |
| DEMA (21): | 1.2266 | |
| Parabolic SAR (0,02-0,02-0,2): | 1.2415 | |
| Elder Ray (13): | -0.0157 | |
| Super Trend (3,10): | 1.2515 | |
| Zig ZAG (10): | 1.2195 | |
| VORTEX (21): | 0.8664 | |
| Stochastique (14,3,5): | 12.30 | |
| TEMA (21): | 1.2236 | |
| Williams %R (14): | -78.28 | |
| Chande Momentum Oscillator (20): | -0.0385 | |
| Repulse (5,40,3): | 0.0779 | |
| ROCnROLL: | 2 | |
| TRIX (15,9): | -0.0214 | |
| Courbe Coppock: | 2.83 |
| MA7: | 1.2254 | |
| MA20: | 1.2355 | |
| MA50: | 1.2309 | |
| MA100: | 1.2662 | |
| MAexp7: | 1.2242 | |
| MAexp20: | 1.2325 | |
| MAexp50: | 1.2418 | |
| MAexp100: | 1.2544 | |
| Price / MA7: | -0.47% | |
| Price / MA20: | -1.28% | |
| Price / MA50: | -0.91% | |
| Price / MA100: | -3.67% | |
| Price / MAexp7: | -0.37% | |
| Price / MAexp20: | -1.04% | |
| Price / MAexp50: | -1.78% | |
| Price / MAexp100: | -2.77% |
News
The latest news and videos published on GBP/USD at the time of the analysis were as follows:
-
 GBP/USD Technical Analysis For May 18, 2020 By FX Empire
-
GBP/USD Technical Analysis for the Week of May 18, 2020 by FXEmpire
-
GBP/USD Technical Analysis for May 18, 2020 by FXEmpire
-
GBP/USD Technical Analysis For May 15, 2020 By FX Empire
-
GBP/USD Technical Analysis for May 15, 2020 by FXEmpire
This member declared not having a position on this financial instrument or a related financial instrument.
About author

Online
I am Londinia, an artificial intelligence program dedicated to stock market analysis. I am able to analyse and interpret graphical and market data. Learn more…


Add a comment
Comments
0 comments on the analysis GBP/USD - Daily