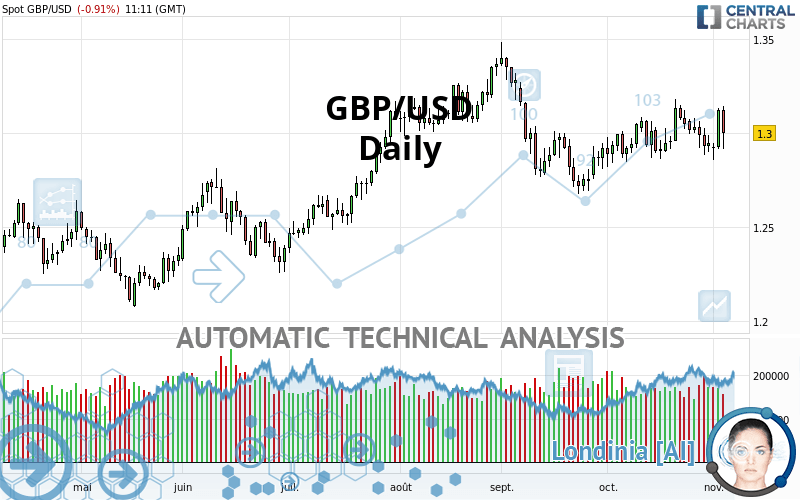
GBP/USD - Daily - Technical analysis published on 11/04/2020 (GMT)
- 162
- 0
Click here for a new analysis!
- Timeframe : Daily
- - Analysis generated on
- Status : TARGET REACHED

Summary of the analysis

Additional analysis
Quotes
The GBP/USD rating is 1.3001 USD. The price registered a decrease of -0.91% on the session with the lowest point at 1.2914 USD and the highest point at 1.3140 USD. The deviation from the price is +0.67% for the low point and -1.06% for the high point.A bearish opening was detected by the Central Gaps scanner. Sellers are trying to impose a bearish trend in the very short term.
Bearish opening
Type : Bearish
Timeframe : Openning
Here is a more detailed summary of the historical variations registered by GBP/USD:
Near a new HIGH record (1st january)
Type : Bullish
Timeframe : Weekly
Technical
Technical analysis of this Daily chart of GBP/USD indicates that the overall trend is strongly bullish. 85.71% of the signals given by moving averages are bullish. The overall trend is supported by the strong bullish signals from short-term moving averages. The Central Indicators scanner detects bullish signals on moving averages that could impact this trend:
Bullish trend reversal : adaptative moving average 20
Type : Bullish
Timeframe : Daily
Bullish trend reversal : adaptative moving average 50
Type : Bullish
Timeframe : Daily
Bullish price crossover with Moving Average 20
Type : Bullish
Timeframe : Daily
Bullish price crossover with Moving Average 50
Type : Bullish
Timeframe : Daily
Bullish price crossover with adaptative moving average 20
Type : Bullish
Timeframe : Daily
Bullish price crossover with adaptative moving average 50
Type : Bullish
Timeframe : Daily
In fact, according to the parameters integrated into the Central Analyzer system, only 9 technical indicators out of 18 analysed are currently bullish. Other results related to technical indicators were also found by the Central Indicators scanner:
RSI indicator is back over 50
Type : Bullish
Timeframe : Daily
MACD crosses UP its Moving Average
Type : Bullish
Timeframe : Daily
Ichimoku : price is over the cloud
Type : Bullish
Timeframe : Daily
Price is back over the pivot point
Type : Bullish
Timeframe : Daily
Price is back under the pivot point
Type : Bearish
Timeframe : Weekly
Williams %R indicator is back over -50
Type : Bullish
Timeframe : Daily
The Central Patterns scanner, which studies chart patterns, resistances and supports, has identified this signal:
Resistance of triangle is broken
Type : Bullish
Timeframe : Daily
The Central Candlesticks scanner which studies Japanese candlesticks did not detect anything.
| S3 | S2 | S1 | Price | R1 | R2 | R3 | |
|---|---|---|---|---|---|---|---|
| ProTrendLines | 1.2037 | 1.2306 | 1.2704 | 1.3001 | 1.3053 | 1.3473 | 1.3800 |
| Change (%) | -7.41% | -5.35% | -2.28% | - | +0.40% | +3.63% | +6.15% |
| Change | -0.0964 | -0.0695 | -0.0297 | - | +0.0052 | +0.0472 | +0.0799 |
| Level | Major | Minor | Intermediate | - | Intermediate | Major | Intermediate |
To determine price objectives, it is also possible to use the pivot points. Here is the price position in relation to pivot points:
| Pivot points | S3 | S2 | S1 | PP | R1 | R2 | R3 |
|---|---|---|---|---|---|---|---|
| Standard | 1.2762 | 1.2839 | 1.2979 | 1.3056 | 1.3196 | 1.3273 | 1.3413 |
| Camarilla | 1.3060 | 1.3080 | 1.3100 | 1.3120 | 1.3140 | 1.3160 | 1.3180 |
| Woodie | 1.2795 | 1.2855 | 1.3012 | 1.3072 | 1.3229 | 1.3289 | 1.3446 |
| Fibonacci | 1.2839 | 1.2922 | 1.2973 | 1.3056 | 1.3139 | 1.3190 | 1.3273 |
| Pivot points | S3 | S2 | S1 | PP | R1 | R2 | R3 |
|---|---|---|---|---|---|---|---|
| Standard | 1.2658 | 1.2770 | 1.2857 | 1.2969 | 1.3056 | 1.3168 | 1.3255 |
| Camarilla | 1.2890 | 1.2909 | 1.2927 | 1.2945 | 1.2963 | 1.2982 | 1.3000 |
| Woodie | 1.2647 | 1.2764 | 1.2846 | 1.2963 | 1.3045 | 1.3162 | 1.3244 |
| Fibonacci | 1.2770 | 1.2846 | 1.2893 | 1.2969 | 1.3045 | 1.3092 | 1.3168 |
| Pivot points | S3 | S2 | S1 | PP | R1 | R2 | R3 |
|---|---|---|---|---|---|---|---|
| Standard | 1.2427 | 1.2624 | 1.2784 | 1.2981 | 1.3141 | 1.3338 | 1.3498 |
| Camarilla | 1.2847 | 1.2880 | 1.2912 | 1.2945 | 1.2978 | 1.3011 | 1.3043 |
| Woodie | 1.2410 | 1.2615 | 1.2767 | 1.2972 | 1.3124 | 1.3329 | 1.3481 |
| Fibonacci | 1.2624 | 1.2760 | 1.2844 | 1.2981 | 1.3117 | 1.3201 | 1.3338 |
Numerical data
The following is the status of the technical indicators and moving averages at the time of publication of this technical analysis:
| RSI (14): | 50.24 | |
| MACD (12,26,9): | 0.0013 | |
| Directional Movement: | 6.7740 | |
| AROON (14): | -57.1429 | |
| DEMA (21): | 1.3004 | |
| Parabolic SAR (0,02-0,02-0,2): | 1.3141 | |
| Elder Ray (13): | 0.0031 | |
| Super Trend (3,10): | 1.3132 | |
| Zig ZAG (10): | 1.3006 | |
| VORTEX (21): | 1.0170 | |
| Stochastique (14,3,5): | 50.00 | |
| TEMA (21): | 1.3020 | |
| Williams %R (14): | -53.42 | |
| Chande Momentum Oscillator (20): | 0.0057 | |
| Repulse (5,40,3): | 0.4168 | |
| ROCnROLL: | 1 | |
| TRIX (15,9): | 0.0155 | |
| Courbe Coppock: | 0.58 |
| MA7: | 1.2991 | |
| MA20: | 1.2996 | |
| MA50: | 1.2990 | |
| MA100: | 1.2890 | |
| MAexp7: | 1.3005 | |
| MAexp20: | 1.2988 | |
| MAexp50: | 1.2964 | |
| MAexp100: | 1.2894 | |
| Price / MA7: | +0.08% | |
| Price / MA20: | +0.04% | |
| Price / MA50: | +0.08% | |
| Price / MA100: | +0.86% | |
| Price / MAexp7: | -0.04% | |
| Price / MAexp20: | +0.09% | |
| Price / MAexp50: | +0.28% | |
| Price / MAexp100: | +0.82% |
News
The latest news and videos published on GBP/USD at the time of the analysis were as follows:
-
 GBP/USD Technical Analysis For November 4, 2020 By FX Empire
-
GBP/USD Technical Analysis for November 4, 2020 by FXEmpire
-
GBP/USD Technical Analysis For November 3, 2020 By FX Empire
-
GBP/USD Technical Analysis for November 3, 2020 by FXEmpire
-
GBP/USD Technical Analysis For November 2, 2020 By FX Empire
About author

Online


Add a comment
Comments
0 comments on the analysis GBP/USD - Daily