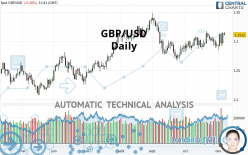
GBP/USD - Daily - Technical analysis published on 11/06/2020 (GMT)
- Who voted?
- 134
- 0
Click here for a new analysis!
- Timeframe : Daily
- - Analysis generated on
- Status : TARGET REACHED

Summary of the analysis

Additional analysis
Quotes
The GBP/USD price is 1.3112 USD. On the day, this instrument lost -0.20% and was traded between 1.3101 USD and 1.3157 USD over the period. The price is currently at +0.08% from its lowest and -0.34% from its highest.The Central Gaps scanner detects a bullish opening marking the presence of buyers ahead of sellers at the opening but not sufficiently marked to allow the price to register a quotation gap.
Bullish opening
Type : Bullish
Timeframe : Openning
So that you have an overall view of the price change, here is a table showing the variations over several periods:
Near a new HIGH record (1st january)
Type : Bullish
Timeframe : Weekly
Technical
A technical analysis in Daily of this GBP/USD chart shows a strongly bullish trend. 85.71% of the signals given by moving averages are bullish. This strongly bullish trend is supported by the strong bullish signals given by short-term moving averages. The Central Indicators market scanner is currently detecting several bullish signals that could impact this trend:
Bullish price crossover with Moving Average 20
Type : Bullish
Timeframe : Daily
Bullish price crossover with Moving Average 50
Type : Bullish
Timeframe : Daily
Bullish price crossover with adaptative moving average 20
Type : Bullish
Timeframe : Daily
Bullish price crossover with adaptative moving average 50
Type : Bullish
Timeframe : Daily
Technical indicators are strongly bullish, suggesting that the price increase should continue.
Caution: the Central Indicators scanner currently detects an excess:
CCI indicator is overbought : over 100
Type : Neutral
Timeframe : Daily
MACD indicator: bullish divergence
Type : Bullish
Timeframe : Daily
Williams %R indicator is overbought : over -20
Type : Neutral
Timeframe : Daily
Pivot points : price is over resistance 1
Type : Neutral
Timeframe : Weekly
RSI indicator is back over 50
Type : Bullish
Timeframe : Daily
MACD crosses UP its Moving Average
Type : Bullish
Timeframe : Daily
Parabolic SAR indicator bullish reversal
Type : Bullish
Timeframe : Daily
Ichimoku : price is over the cloud
Type : Bullish
Timeframe : Daily
SuperTrend indicator bullish reversal
Type : Bullish
Timeframe : Daily
Price is back over the pivot point
Type : Bullish
Timeframe : Daily
Price is back under the pivot point
Type : Bearish
Timeframe : Weekly
Williams %R indicator is back over -50
Type : Bullish
Timeframe : Daily
Central Patterns, the market scanner focusing on chart patterns, resistances and supports found this result:
Resistance of triangle is broken
Type : Bullish
Timeframe : Daily
The Central Candlesticks scanner, specialised in Japanese candlesticks, did not identify any signals.
| S3 | S2 | S1 | Price | R1 | R2 | R3 | |
|---|---|---|---|---|---|---|---|
| ProTrendLines | 1.2306 | 1.2704 | 1.3053 | 1.3112 | 1.3253 | 1.3473 | 1.3800 |
| Change (%) | -6.15% | -3.11% | -0.45% | - | +1.08% | +2.75% | +5.25% |
| Change | -0.0806 | -0.0408 | -0.0059 | - | +0.0141 | +0.0361 | +0.0688 |
| Level | Minor | Intermediate | Major | - | Minor | Major | Intermediate |
Attention could also be paid to pivot points to set price objectives:
| Pivot points | S3 | S2 | S1 | PP | R1 | R2 | R3 |
|---|---|---|---|---|---|---|---|
| Standard | 1.2781 | 1.2861 | 1.2999 | 1.3079 | 1.3217 | 1.3297 | 1.3435 |
| Camarilla | 1.3078 | 1.3098 | 1.3118 | 1.3138 | 1.3158 | 1.3178 | 1.3198 |
| Woodie | 1.2811 | 1.2876 | 1.3029 | 1.3094 | 1.3247 | 1.3312 | 1.3465 |
| Fibonacci | 1.2861 | 1.2944 | 1.2995 | 1.3079 | 1.3162 | 1.3213 | 1.3297 |
| Pivot points | S3 | S2 | S1 | PP | R1 | R2 | R3 |
|---|---|---|---|---|---|---|---|
| Standard | 1.2658 | 1.2770 | 1.2857 | 1.2969 | 1.3056 | 1.3168 | 1.3255 |
| Camarilla | 1.2890 | 1.2909 | 1.2927 | 1.2945 | 1.2963 | 1.2982 | 1.3000 |
| Woodie | 1.2647 | 1.2764 | 1.2846 | 1.2963 | 1.3045 | 1.3162 | 1.3244 |
| Fibonacci | 1.2770 | 1.2846 | 1.2893 | 1.2969 | 1.3045 | 1.3092 | 1.3168 |
| Pivot points | S3 | S2 | S1 | PP | R1 | R2 | R3 |
|---|---|---|---|---|---|---|---|
| Standard | 1.2427 | 1.2624 | 1.2784 | 1.2981 | 1.3141 | 1.3338 | 1.3498 |
| Camarilla | 1.2847 | 1.2880 | 1.2912 | 1.2945 | 1.2978 | 1.3011 | 1.3043 |
| Woodie | 1.2410 | 1.2615 | 1.2767 | 1.2972 | 1.3124 | 1.3329 | 1.3481 |
| Fibonacci | 1.2624 | 1.2760 | 1.2844 | 1.2981 | 1.3117 | 1.3201 | 1.3338 |
Numerical data
The following are the details of the technical indicators and moving averages that were collected to generate this technical analysis:
| RSI (14): | 56.58 | |
| MACD (12,26,9): | 0.0029 | |
| Directional Movement: | 6.7313 | |
| AROON (14): | -57.1429 | |
| DEMA (21): | 1.3043 | |
| Parabolic SAR (0,02-0,02-0,2): | 1.2861 | |
| Elder Ray (13): | 0.0102 | |
| Super Trend (3,10): | 1.2724 | |
| Zig ZAG (10): | 1.3116 | |
| VORTEX (21): | 1.0756 | |
| Stochastique (14,3,5): | 67.29 | |
| TEMA (21): | 1.3066 | |
| Williams %R (14): | -20.81 | |
| Chande Momentum Oscillator (20): | -0.0014 | |
| Repulse (5,40,3): | 0.8792 | |
| ROCnROLL: | 1 | |
| TRIX (15,9): | 0.0199 | |
| Courbe Coppock: | 0.85 |
| MA7: | 1.3021 | |
| MA20: | 1.3008 | |
| MA50: | 1.2983 | |
| MA100: | 1.2904 | |
| MAexp7: | 1.3055 | |
| MAexp20: | 1.3011 | |
| MAexp50: | 1.2975 | |
| MAexp100: | 1.2903 | |
| Price / MA7: | +0.70% | |
| Price / MA20: | +0.80% | |
| Price / MA50: | +0.99% | |
| Price / MA100: | +1.61% | |
| Price / MAexp7: | +0.44% | |
| Price / MAexp20: | +0.78% | |
| Price / MAexp50: | +1.06% | |
| Price / MAexp100: | +1.62% |
News
The last news published on GBP/USD at the time of the generation of this analysis was as follows:
-
 GBP/USD Technical Analysis For November 6, 2020 By FX Empire
-
GBP/USD Technical Analysis for November 6, 2020 by FXEmpire
-
GBP/USD Technical Analysis For November 5, 2020 By FX Empire
-
GBP/USD Technical Analysis for November 5, 2020 by FXEmpire
-
GBP/USD Technical Analysis For November 4, 2020 By FX Empire
About author

Online


Add a comment
Comments
0 comments on the analysis GBP/USD - Daily