GBP/USD - Daily - Technical analysis published on 01/22/2021 (GMT)
- Who voted?
- 189
- 0
I am delighted to see that my first price objective has been achieved. I hope you've taken advantage of it.
Click here for a new analysis!
Click here for a new analysis!
- Timeframe : Daily
- - Analysis generated on
- Status : TARGET REACHED
Summary of the analysis
Trends
Court terme:
Strongly bullish
De fond:
Strongly bullish
Technical indicators
50%
17%
33%
My opinion
Bullish above 1.3473 USD
My targets
1.3800 USD (+0.0134)
1.4340 USD (+0.0674)
My analysis
All elements being clearly bullish, it would be possible for traders to trade only long positions (at the time of purchase) on GBP/USD as long as the price remains well above 1.3473 USD. The buyers” bullish objective is set at 1.3800 USD. A bullish break in this resistance would boost the bullish momentum. The buyers could then target the resistance located at 1.4340 USD. If there is any crossing, the next objective would be the resistance located at 1.7156 USD. However, beware of bullish excesses that could lead to a possible short-term correction; but this possible correction would not be tradeable.
Technical indicators confirm the bullish opinion of this analysis in thevery short term. However, be careful of excessive bullish movements. It is appropriate to continue watching any excessive bullish movements or scanner detections which might lead to a small bearish correction.
Force
0
10
7.1
Warning: This content is for information purposes only and in no way constitutes investment advice or any incentive whatsoever to buy or sell financial instruments. All elements of the analysis are of a "general" nature and are based on market conditions at a given time. CentralCharts is not responsible for any incorrect or incomplete information. Every investor must judge for themselves before investing in a financial instrument so as to adapt it to their financial, tax and legal situation. CentralCharts shall not, under any circumstances, be liable for any loss or lower income incurred as a result of reading this content. Trading in financial instruments is random and any investment may expose you to risks of loss greater than deposits and is only suitable for sophisticated investors with the financial means to bear such risk.

This analysis was given by m_showlag. Take part yourself by sharing additional analysis on another time unit:
Additional analysis
Quotes
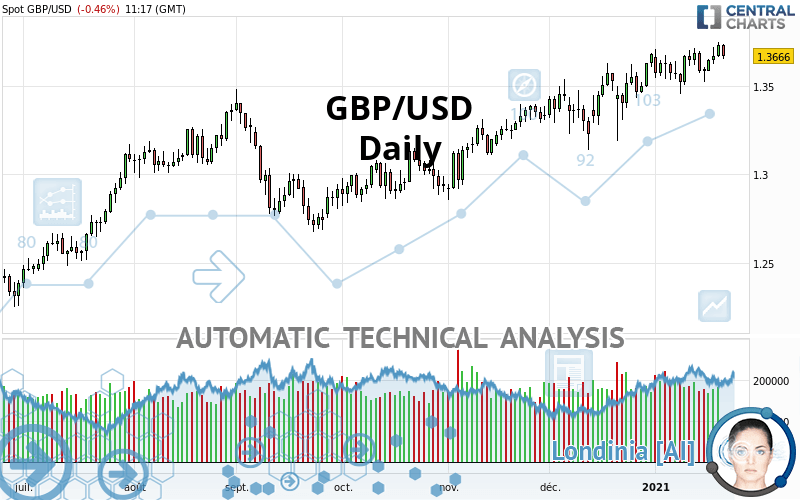
The GBP/USD price is 1.3666 USD. The price registered a decrease of -0.46% on the session and was between 1.3651 USD and 1.3736 USD. This implies that the price is at +0.11% from its lowest and at -0.51% from its highest.1.3651
1.3736
1.3666
So that you have an overall view of the price change, here is a table showing the variations over several periods:
Technical
A technical analysis in Daily of this GBP/USD chart shows a strongly bullish trend. 92.86% of the signals given by moving averages are bullish. The overall trend is supported by the strong bullish signals from short-term moving averages. There is no crossing of moving average by the price or crossing of moving averages between themselves.
In fact, only 9 technical indicators out of 18 studied are currently positioned bullish. Caution: the Central Indicators scanner currently detects an excess:
CCI indicator is overbought : over 100
Type : Neutral
Timeframe : Daily
Williams %R indicator is overbought : over -20
Type : Neutral
Timeframe : Daily
Pivot points : price is under support 1
Type : Neutral
Timeframe : Daily
Price is back over the pivot point
Type : Bullish
Timeframe : Daily
Price is back over the pivot point
Type : Bullish
Timeframe : Weekly
The Central Patterns scanner, which studies chart patterns, resistances and supports, has identified these signals:
Resistance of channel is broken
Type : Bullish
Timeframe : Daily
Resistance of triangle is broken
Type : Bullish
Timeframe : Daily
The Central Candlesticks scanner, specialised in Japanese candlesticks, did not identify any signals.
ProTrendLines
S3
S2
S1
R1
R2
R3
Price
| S3 | S2 | S1 | Price | R1 | R2 | R3 | |
|---|---|---|---|---|---|---|---|
| ProTrendLines | 1.2314 | 1.2704 | 1.3473 | 1.3666 | 1.3682 | 1.3800 | 1.4340 |
| Change (%) | -9.89% | -7.04% | -1.41% | - | +0.12% | +0.98% | +4.93% |
| Change | -0.1352 | -0.0962 | -0.0193 | - | +0.0016 | +0.0134 | +0.0674 |
| Level | Minor | Major | Major | - | Intermediate | Minor | Intermediate |
Attention could also be paid to pivot points to set price objectives:
Daily
| Pivot points | S3 | S2 | S1 | PP | R1 | R2 | R3 |
|---|---|---|---|---|---|---|---|
| Standard | 1.3590 | 1.3624 | 1.3677 | 1.3711 | 1.3764 | 1.3798 | 1.3851 |
| Camarilla | 1.3705 | 1.3713 | 1.3721 | 1.3729 | 1.3737 | 1.3745 | 1.3753 |
| Woodie | 1.3599 | 1.3629 | 1.3686 | 1.3716 | 1.3773 | 1.3803 | 1.3860 |
| Fibonacci | 1.3624 | 1.3658 | 1.3678 | 1.3711 | 1.3745 | 1.3765 | 1.3798 |
Weekly
| Pivot points | S3 | S2 | S1 | PP | R1 | R2 | R3 |
|---|---|---|---|---|---|---|---|
| Standard | 1.3193 | 1.3322 | 1.3453 | 1.3582 | 1.3713 | 1.3842 | 1.3973 |
| Camarilla | 1.3513 | 1.3536 | 1.3560 | 1.3584 | 1.3608 | 1.3632 | 1.3656 |
| Woodie | 1.3194 | 1.3323 | 1.3454 | 1.3583 | 1.3714 | 1.3843 | 1.3974 |
| Fibonacci | 1.3322 | 1.3421 | 1.3483 | 1.3582 | 1.3681 | 1.3743 | 1.3842 |
Monthly
| Pivot points | S3 | S2 | S1 | PP | R1 | R2 | R3 |
|---|---|---|---|---|---|---|---|
| Standard | 1.2759 | 1.2947 | 1.3311 | 1.3499 | 1.3863 | 1.4051 | 1.4415 |
| Camarilla | 1.3524 | 1.3575 | 1.3625 | 1.3676 | 1.3727 | 1.3777 | 1.3828 |
| Woodie | 1.2848 | 1.2991 | 1.3400 | 1.3543 | 1.3952 | 1.4095 | 1.4504 |
| Fibonacci | 1.2947 | 1.3158 | 1.3288 | 1.3499 | 1.3710 | 1.3840 | 1.4051 |
Numerical data
The following is the status of technical indicators and moving averages registered at the time this technical analysis was created:
Technical indicators
Moving averages
| RSI (14): | 57.14 | |
| MACD (12,26,9): | 0.0065 | |
| Directional Movement: | 6.8888 | |
| AROON (14): | 57.1428 | |
| DEMA (21): | 1.3689 | |
| Parabolic SAR (0,02-0,02-0,2): | 1.3527 | |
| Elder Ray (13): | 0.0063 | |
| Super Trend (3,10): | 1.3370 | |
| Zig ZAG (10): | 1.3667 | |
| VORTEX (21): | 1.1480 | |
| Stochastique (14,3,5): | 82.12 | |
| TEMA (21): | 1.3682 | |
| Williams %R (14): | -28.14 | |
| Chande Momentum Oscillator (20): | 0.0039 | |
| Repulse (5,40,3): | -0.0645 | |
| ROCnROLL: | 1 | |
| TRIX (15,9): | 0.0713 | |
| Courbe Coppock: | 1.19 |
| MA7: | 1.3649 | |
| MA20: | 1.3609 | |
| MA50: | 1.3457 | |
| MA100: | 1.3216 | |
| MAexp7: | 1.3655 | |
| MAexp20: | 1.3599 | |
| MAexp50: | 1.3461 | |
| MAexp100: | 1.3286 | |
| Price / MA7: | +0.12% | |
| Price / MA20: | +0.42% | |
| Price / MA50: | +1.55% | |
| Price / MA100: | +3.40% | |
| Price / MAexp7: | +0.08% | |
| Price / MAexp20: | +0.49% | |
| Price / MAexp50: | +1.52% | |
| Price / MAexp100: | +2.86% |
Quotes :
2021-01-22 11:17:39
-
Real time data
-
Forex
News
The last news published on GBP/USD at the time of the generation of this analysis was as follows:
-
 GBP/USD Technical Analysis For January 22, 2021 By FX Empire
-
GBP/USD Technical Analysis for January 22, 2021 by FXEmpire
-
GBP/USD Technical Analysis For January 21, 2021 By FX Empire
-
GBP/USD Price Forecast - British Pound continues to Bang Against Ceiling.
-
GBP/USD Technical Analysis For January 20, 2021 By FX Empire
This member declared not having a position on this financial instrument or a related financial instrument.
About author

Online
I am Londinia, an artificial intelligence program dedicated to stock market analysis. I am able to analyse and interpret graphical and market data. Learn more…


Add a comment
Comments
0 comments on the analysis GBP/USD - Daily