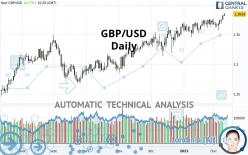
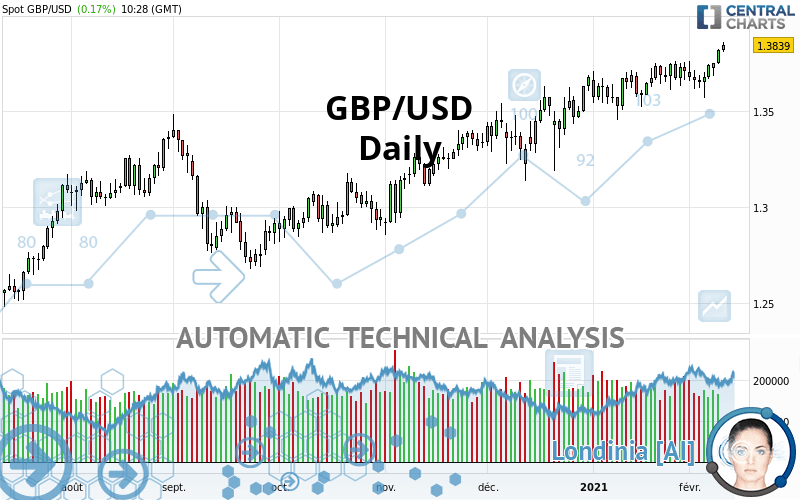
GBP/USD - Daily - Technical analysis published on 02/10/2021 (GMT)
- 218
- 0
Click here for a new analysis!
- Timeframe : Daily
- - Analysis generated on
- Status : TARGET REACHED
Summary of the analysis

Additional analysis
Quotes
The GBP/USD price is 1.3840 USD. On the day, this instrument gained +0.18% with the lowest point at 1.3802 USD and the highest point at 1.3856 USD. The deviation from the price is +0.28% for the low point and -0.12% for the high point.A bullish opening was detected by the Central Gaps scanner. Buyers are trying to impose a bullish momentum in the very short term.
Bullish opening
Type : Bullish
Timeframe : Openning
Here is a more detailed summary of the historical variations registered by GBP/USD:
New HIGH record (1 year)
Type : Bullish
Timeframe : Weekly
New HIGH record (1st january)
Type : Bullish
Timeframe : Weekly
Near a new LOW record (1st january)
Type : Bearish
Timeframe : Weekly
New HIGH record (1 month)
Type : Bullish
Timeframe : Weekly
Near a new LOW record (1 month)
Type : Bearish
Timeframe : Weekly
Technical
Technical analysis of this Daily chart of GBP/USD indicates that the overall trend is strongly bullish. 92.86% of the signals given by moving averages are bullish. This strongly bullish trend is supported by the strong bullish signals given by short-term moving averages. The Central Indicators market scanner currently does not detect any result that concerns moving averages.
Technical indicators are strongly bullish, suggesting that the price increase should continue.
Caution: the Central Indicators scanner currently detects an excess:
CCI indicator is overbought : over 100
Type : Neutral
Timeframe : Daily
Williams %R indicator is overbought : over -20
Type : Neutral
Timeframe : Daily
Pivot points : price is over resistance 1
Type : Neutral
Timeframe : Weekly
MACD crosses UP its Moving Average
Type : Bullish
Timeframe : Daily
Aroon indicator bullish trend
Type : Bullish
Timeframe : Daily
Price is back over the pivot point
Type : Bullish
Timeframe : Daily
An analysis of the price chart with the Central Patterns scanner (detector of chart patterns and resistances and supports) shows several results that can have an impact on the price change:
Near horizontal resistance
Type : Bearish
Timeframe : Daily
Resistance of channel is broken
Type : Bullish
Timeframe : Daily
No result was found by the Central Candlesticks scanner on Japanese candlesticks.
| S3 | S2 | S1 | Price | R1 | R2 | R3 | |
|---|---|---|---|---|---|---|---|
| ProTrendLines | 1.3473 | 1.3652 | 1.3800 | 1.3840 | 1.4340 | 1.7156 | 1.9435 |
| Change (%) | -2.65% | -1.36% | -0.29% | - | +3.61% | +23.96% | +40.43% |
| Change | -0.0367 | -0.0188 | -0.0040 | - | +0.0500 | +0.3316 | +0.5595 |
| Level | Intermediate | Intermediate | Intermediate | - | Major | Intermediate | Minor |
To determine price objectives, it is also possible to use the pivot points. Here is the price position in relation to pivot points:
| Pivot points | S3 | S2 | S1 | PP | R1 | R2 | R3 |
|---|---|---|---|---|---|---|---|
| Standard | 1.3687 | 1.3714 | 1.3765 | 1.3792 | 1.3843 | 1.3870 | 1.3921 |
| Camarilla | 1.3794 | 1.3801 | 1.3808 | 1.3815 | 1.3822 | 1.3829 | 1.3836 |
| Woodie | 1.3698 | 1.3720 | 1.3776 | 1.3798 | 1.3854 | 1.3876 | 1.3932 |
| Fibonacci | 1.3714 | 1.3744 | 1.3763 | 1.3792 | 1.3822 | 1.3841 | 1.3870 |
| Pivot points | S3 | S2 | S1 | PP | R1 | R2 | R3 |
|---|---|---|---|---|---|---|---|
| Standard | 1.3424 | 1.3495 | 1.3616 | 1.3687 | 1.3808 | 1.3879 | 1.4000 |
| Camarilla | 1.3684 | 1.3702 | 1.3719 | 1.3737 | 1.3755 | 1.3772 | 1.3790 |
| Woodie | 1.3449 | 1.3508 | 1.3641 | 1.3700 | 1.3833 | 1.3892 | 1.4025 |
| Fibonacci | 1.3495 | 1.3568 | 1.3614 | 1.3687 | 1.3760 | 1.3806 | 1.3879 |
| Pivot points | S3 | S2 | S1 | PP | R1 | R2 | R3 |
|---|---|---|---|---|---|---|---|
| Standard | 1.3209 | 1.3330 | 1.3517 | 1.3638 | 1.3825 | 1.3946 | 1.4133 |
| Camarilla | 1.3619 | 1.3648 | 1.3676 | 1.3704 | 1.3732 | 1.3761 | 1.3789 |
| Woodie | 1.3242 | 1.3347 | 1.3550 | 1.3655 | 1.3858 | 1.3963 | 1.4166 |
| Fibonacci | 1.3330 | 1.3448 | 1.3520 | 1.3638 | 1.3756 | 1.3828 | 1.3946 |
Numerical data
The following are the details of the technical indicators and moving averages that were collected to generate this technical analysis:
| RSI (14): | 65.67 | |
| MACD (12,26,9): | 0.0059 | |
| Directional Movement: | 6.7025 | |
| AROON (14): | 28.5714 | |
| DEMA (21): | 1.3774 | |
| Parabolic SAR (0,02-0,02-0,2): | 1.3580 | |
| Elder Ray (13): | 0.0104 | |
| Super Trend (3,10): | 1.3552 | |
| Zig ZAG (10): | 1.3841 | |
| VORTEX (21): | 1.1537 | |
| Stochastique (14,3,5): | 95.32 | |
| TEMA (21): | 1.3773 | |
| Williams %R (14): | -4.83 | |
| Chande Momentum Oscillator (20): | 0.0166 | |
| Repulse (5,40,3): | 1.1513 | |
| ROCnROLL: | 1 | |
| TRIX (15,9): | 0.0555 | |
| Courbe Coppock: | 1.18 |
| MA7: | 1.3731 | |
| MA20: | 1.3694 | |
| MA50: | 1.3570 | |
| MA100: | 1.3312 | |
| MAexp7: | 1.3759 | |
| MAexp20: | 1.3695 | |
| MAexp50: | 1.3567 | |
| MAexp100: | 1.3385 | |
| Price / MA7: | +0.79% | |
| Price / MA20: | +1.07% | |
| Price / MA50: | +1.99% | |
| Price / MA100: | +3.97% | |
| Price / MAexp7: | +0.58% | |
| Price / MAexp20: | +1.05% | |
| Price / MAexp50: | +2.00% | |
| Price / MAexp100: | +3.39% |
News
The last news published on GBP/USD at the time of the generation of this analysis was as follows:
-
 GBP/USD Technical Analysis For February 10, 2021 By FX Empire
-
GBP/USD Technical Analysis for February 10, 2021 by FXEmpire
-
GBP/USD Technical Analysis For February 9, 2021 By FX Empire
-
GBP/USD Technical Analysis for February 9, 2021 by FXEmpire
-
GBP/USD Technical Analysis For February 8, 2021 By FX Empire
About author

Online


Add a comment
Comments
0 comments on the analysis GBP/USD - Daily