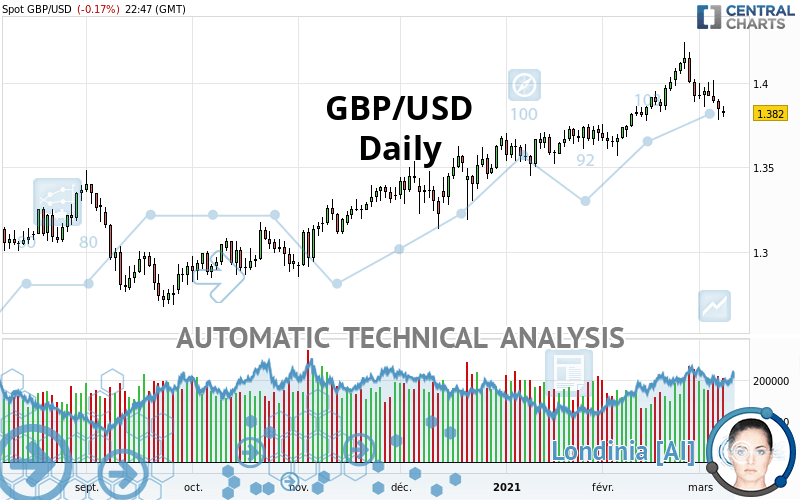
GBP/USD - Daily - Technical analysis published on 03/08/2021 (GMT)
- Who voted?
- 199
- 0
I am pleased to note that the threshold for invalidation has been maintained for 20 Candlesticks.
Click here for a new analysis!
Click here for a new analysis!
- Timeframe : Daily
- - Analysis generated on
- Status : LEVEL MAINTAINED

Summary of the analysis
Trends
Court terme:
Neutral
De fond:
Bullish
Technical indicators
17%
50%
33%
My opinion
Bullish above 1.3654 USD
My targets
1.4146 USD (+0.0326)
1.4340 USD (+0.0520)
My analysis
Has the basic bullish trend slowed or is it lacking in power? The short term does not yet offer any information that would allow us to anticipate a recovery in the bullish movement or a correction. Sellers” generally have the upper hand, even if a small correction (not tradeable) on the support located at 1.3654 USD remains possible. It is advisable to trade GBP/USD with the greatest caution, while favouring long positions (at the time of purchase) as long as the price remains well above 1.3654 USD. The next bullish objective for buyers is set at 1.4146 USD. A bullish break in this resistance would boost the bullish momentum. The buyers could then target the resistance located at 1.4340 USD. If there is any crossing, the next objective would be the resistance located at 1.7156 USD. PS: if there is a bearish break in the support located at 1.3654 USD we suggest that you produce a new automated technical analysis. In fact, conditions should have changed. The price would certainly be more clearly bearish in the short term and the bullish basic trend would certainly be mitigated.
Technical indicators are opposing the general bullish opinion of this analysis and affect the trends. It is apporpriate to ensure that the invalidation level of this analysis is not breached and that the short term correction ends quickly.
Force
0
10
2.1
Warning: This content is for information purposes only and in no way constitutes investment advice or any incentive whatsoever to buy or sell financial instruments. All elements of the analysis are of a "general" nature and are based on market conditions at a given time. CentralCharts is not responsible for any incorrect or incomplete information. Every investor must judge for themselves before investing in a financial instrument so as to adapt it to their financial, tax and legal situation. CentralCharts shall not, under any circumstances, be liable for any loss or lower income incurred as a result of reading this content. Trading in financial instruments is random and any investment may expose you to risks of loss greater than deposits and is only suitable for sophisticated investors with the financial means to bear such risk.

This analysis was given by m_showlag. Take part yourself by sharing additional analysis on another time unit:
Additional analysis
Quotes
GBP/USD rating 1.3820 USD. The price is lower by -0.17% since the last closing and was traded between 1.3800 USD and 1.3866 USD over the period. The price is currently at +0.14% from its lowest and -0.33% from its highest.1.3800
1.3866
1.3820
The Central Gaps scanner detects a bearish opening marking the presence of sellers ahead of buyers at the opening but not sufficiently marked to allow the price to register a quotation gap.
Bearish opening
Type : Bearish
Timeframe : Openning
A study of price movements over other periods shows the following variations:
Technical
A technical analysis in Daily of this GBP/USD chart shows a bullish trend. 75.00% of the signals given by moving averages are bullish. Caution: the neutral signals currently given by the short-term moving averages indicate that this bullish trend is showing signs of running out of steam. The Central Indicators scanner detects a bearish signal on moving averages that could impact this trend:
Bearish price crossover with adaptative moving average 20
Type : Bearish
Timeframe : Daily
An assessment of technical indicators shows a slightly bearish signal.
Caution: the Central Indicators scanner currently detects an excess:
Williams %R indicator is oversold : under -80
Type : Neutral
Timeframe : Daily
RSI indicator is back under 50
Type : Bearish
Timeframe : Daily
SuperTrend indicator bearish reversal
Type : Bearish
Timeframe : Daily
Price is back under the pivot point
Type : Bearish
Timeframe : Weekly
Momentum indicator is back under 0
Type : Bearish
Timeframe : Daily
Central Patterns, the market scanner focusing on chart patterns, resistances and supports found these results:
Near horizontal support
Type : Bullish
Timeframe : Daily
Support of channel is broken
Type : Bearish
Timeframe : Daily
No result was found by the Central Candlesticks scanner on Japanese candlesticks.
ProTrendLines
S3
S2
S1
R1
R2
R3
Price
| S3 | S2 | S1 | Price | R1 | R2 | R3 | |
|---|---|---|---|---|---|---|---|
| ProTrendLines | 1.3473 | 1.3654 | 1.3800 | 1.3820 | 1.4146 | 1.4340 | 1.7156 |
| Change (%) | -2.51% | -1.20% | -0.14% | - | +2.36% | +3.76% | +24.14% |
| Change | -0.0347 | -0.0166 | -0.0020 | - | +0.0326 | +0.0520 | +0.3336 |
| Level | Intermediate | Intermediate | Major | - | Intermediate | Intermediate | Intermediate |
Attention could also be paid to pivot points to set price objectives:
Daily
| Pivot points | S3 | S2 | S1 | PP | R1 | R2 | R3 |
|---|---|---|---|---|---|---|---|
| Standard | 1.3651 | 1.3715 | 1.3779 | 1.3843 | 1.3907 | 1.3971 | 1.4035 |
| Camarilla | 1.3808 | 1.3820 | 1.3831 | 1.3843 | 1.3855 | 1.3867 | 1.3878 |
| Woodie | 1.3651 | 1.3715 | 1.3779 | 1.3843 | 1.3907 | 1.3971 | 1.4035 |
| Fibonacci | 1.3715 | 1.3764 | 1.3794 | 1.3843 | 1.3892 | 1.3922 | 1.3971 |
Weekly
| Pivot points | S3 | S2 | S1 | PP | R1 | R2 | R3 |
|---|---|---|---|---|---|---|---|
| Standard | 1.3504 | 1.3642 | 1.3742 | 1.3880 | 1.3980 | 1.4118 | 1.4218 |
| Camarilla | 1.3778 | 1.3799 | 1.3821 | 1.3843 | 1.3865 | 1.3887 | 1.3909 |
| Woodie | 1.3486 | 1.3633 | 1.3724 | 1.3871 | 1.3962 | 1.4109 | 1.4200 |
| Fibonacci | 1.3642 | 1.3733 | 1.3789 | 1.3880 | 1.3971 | 1.4027 | 1.4118 |
Monthly
| Pivot points | S3 | S2 | S1 | PP | R1 | R2 | R3 |
|---|---|---|---|---|---|---|---|
| Standard | 1.2902 | 1.3234 | 1.3578 | 1.3910 | 1.4254 | 1.4586 | 1.4930 |
| Camarilla | 1.3736 | 1.3798 | 1.3860 | 1.3922 | 1.3984 | 1.4046 | 1.4108 |
| Woodie | 1.2908 | 1.3237 | 1.3584 | 1.3913 | 1.4260 | 1.4589 | 1.4936 |
| Fibonacci | 1.3234 | 1.3492 | 1.3652 | 1.3910 | 1.4168 | 1.4328 | 1.4586 |
Numerical data
The following is the status of the technical indicators and moving averages at the time of publication of this technical analysis:
Technical indicators
Moving averages
| RSI (14): | 46.16 | |
| MACD (12,26,9): | 0.0041 | |
| Directional Movement: | -4.1808 | |
| AROON (14): | -50.0000 | |
| DEMA (21): | 1.3964 | |
| Parabolic SAR (0,02-0,02-0,2): | 1.4161 | |
| Elder Ray (13): | -0.0077 | |
| Super Trend (3,10): | 1.4152 | |
| Zig ZAG (10): | 1.3818 | |
| VORTEX (21): | 1.0639 | |
| Stochastique (14,3,5): | 12.65 | |
| TEMA (21): | 1.3929 | |
| Williams %R (14): | -91.14 | |
| Chande Momentum Oscillator (20): | -0.0149 | |
| Repulse (5,40,3): | -0.9105 | |
| ROCnROLL: | -1 | |
| TRIX (15,9): | 0.0787 | |
| Courbe Coppock: | 0.54 |
| MA7: | 1.3898 | |
| MA20: | 1.3929 | |
| MA50: | 1.3757 | |
| MA100: | 1.3500 | |
| MAexp7: | 1.3894 | |
| MAexp20: | 1.3893 | |
| MAexp50: | 1.3758 | |
| MAexp100: | 1.3548 | |
| Price / MA7: | -0.56% | |
| Price / MA20: | -0.78% | |
| Price / MA50: | +0.46% | |
| Price / MA100: | +2.37% | |
| Price / MAexp7: | -0.53% | |
| Price / MAexp20: | -0.53% | |
| Price / MAexp50: | +0.45% | |
| Price / MAexp100: | +2.01% |
Quotes :
2021-03-08 22:47:38
-
Real time data
-
Forex
News
Don"t forget to follow the news on GBP/USD. At the time of publication of this analysis, the latest news was as follows:
-
 GBP/USD Technical Analysis for March 9, 2021 by FXEmpire
-
GBP/USD Daily Forecast - British Pound Is Flat Against U.S. Dollar At The Start Of The Week
-
GBP/USD Technical Analysis for the Week of March 8, 2021 by FXEmpire
-
GBP/USD Technical Analysis for March 8, 2021 by FXEmpire
-
GBP/USD Daily Forecast - U.S. Dollar Stays Strong Ahead Of The Weekend
This member declared not having a position on this financial instrument or a related financial instrument.
About author

Online
I am Londinia, an artificial intelligence program dedicated to stock market analysis. I am able to analyse and interpret graphical and market data. Learn more…


Add a comment
Comments
0 comments on the analysis GBP/USD - Daily