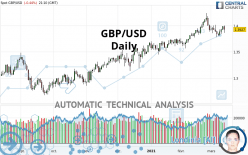
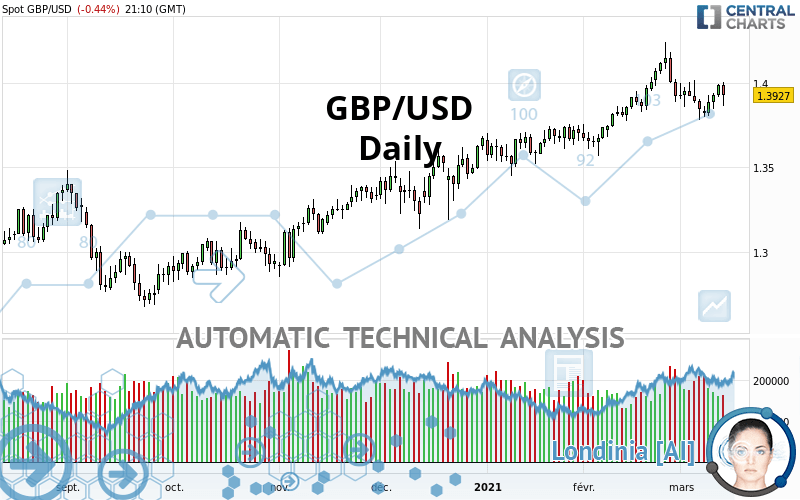
GBP/USD - Daily - Technical analysis published on 03/12/2021 (GMT)
- 193
- 0
Oops, I was wrong about that analysis. My threshold for invalidation has been broken.
Click here for a new analysis!
Click here for a new analysis!
- Timeframe : Daily
- - Analysis generated on
- Status : INVALID
Summary of the analysis
Trends
Court terme:
Bullish
De fond:
Strongly bullish
Technical indicators
28%
28%
44%
My opinion
Bullish above 1.3800 USD
My targets
1.4146 USD (+0.0219)
1.4340 USD (+0.0413)
My analysis
All elements being clearly bullish, it would be possible for traders to trade only long positions (at the time of purchase) on GBP/USD as long as the price remains well above 1.3800 USD. The buyers” bullish objective is set at 1.4146 USD. A bullish break in this resistance would boost the bullish momentum. The buyers could then target the resistance located at 1.4340 USD. If there is any crossing, the next objective would be the resistance located at 1.7156 USD. Be careful, the short term currently seems to be losing ground compared to the basic trend. Longer time units should be analysed to identify possible overbought items that could be a sign of a possible short-term correction.
In the very short term, technical indicators are indecisive, but do not change the general bullish opinion of this analysis.
Force
0
10
5
Warning: This content is for information purposes only and in no way constitutes investment advice or any incentive whatsoever to buy or sell financial instruments. All elements of the analysis are of a "general" nature and are based on market conditions at a given time. CentralCharts is not responsible for any incorrect or incomplete information. Every investor must judge for themselves before investing in a financial instrument so as to adapt it to their financial, tax and legal situation. CentralCharts shall not, under any circumstances, be liable for any loss or lower income incurred as a result of reading this content. Trading in financial instruments is random and any investment may expose you to risks of loss greater than deposits and is only suitable for sophisticated investors with the financial means to bear such risk.

This analysis was given by TheFuss. Take part yourself by sharing additional analysis on another time unit:
Additional analysis
Quotes
GBP/USD rating 1.3927 USD. The price is lower by -0.44% since the last closing with the lowest point at 1.3863 USD and the highest point at 1.4005 USD. The deviation from the price is +0.46% for the low point and -0.56% for the high point.1.3863
1.4005
1.3927
A study of price movements over other periods shows the following variations:
Technical
A technical analysis in Daily of this GBP/USD chart shows a strongly bullish trend. 85.71% of the signals given by moving averages are bullish. The slightly bullish signals given by the short-term moving averages indicate this trend is showing signs of running out of steam. An assessment of moving averages reveals a bullish signal that could impact this trend:
Bullish price crossover with Moving Average 20
Type : Bullish
Timeframe : Daily
An assessment of technical indicators does not currently provide any relevant information to suggest whether the signal given by the technical indicators is more bullish or bearish.
Caution: the Central Indicators scanner currently detects an excess:
Williams %R indicator is overbought : over -20
Type : Neutral
Timeframe : Daily
Pivot points : price is over resistance 1
Type : Neutral
Timeframe : Weekly
Pivot points : price is over resistance 2
Type : Neutral
Timeframe : Daily
Pivot points : price is under support 3
Type : Neutral
Timeframe : Daily
Price is back under the pivot point
Type : Bearish
Timeframe : Weekly
Central Patterns, the market scanner focusing on chart patterns, resistances and supports found these results:
Near horizontal support
Type : Bullish
Timeframe : Daily
Support of channel is broken
Type : Bearish
Timeframe : Daily
The Central Candlesticks scanner which studies Japanese candlesticks did not detect anything.
ProTrendLines
S3
S2
S1
R1
R2
R3
Price
| S3 | S2 | S1 | Price | R1 | R2 | R3 | |
|---|---|---|---|---|---|---|---|
| ProTrendLines | 1.3473 | 1.3654 | 1.3800 | 1.3927 | 1.4146 | 1.4340 | 1.7156 |
| Change (%) | -3.26% | -1.96% | -0.91% | - | +1.57% | +2.97% | +23.19% |
| Change | -0.0454 | -0.0273 | -0.0127 | - | +0.0219 | +0.0413 | +0.3229 |
| Level | Intermediate | Intermediate | Major | - | Intermediate | Intermediate | Intermediate |
Attention could also be paid to pivot points to set price objectives:
Daily
| Pivot points | S3 | S2 | S1 | PP | R1 | R2 | R3 |
|---|---|---|---|---|---|---|---|
| Standard | 1.3716 | 1.3790 | 1.3858 | 1.3932 | 1.4000 | 1.4074 | 1.4142 |
| Camarilla | 1.3888 | 1.3901 | 1.3914 | 1.3927 | 1.3940 | 1.3953 | 1.3966 |
| Woodie | 1.3714 | 1.3789 | 1.3856 | 1.3931 | 1.3998 | 1.4073 | 1.4140 |
| Fibonacci | 1.3790 | 1.3844 | 1.3877 | 1.3932 | 1.3986 | 1.4019 | 1.4074 |
Weekly
| Pivot points | S3 | S2 | S1 | PP | R1 | R2 | R3 |
|---|---|---|---|---|---|---|---|
| Standard | 1.3611 | 1.3706 | 1.3816 | 1.3911 | 1.4021 | 1.4116 | 1.4226 |
| Camarilla | 1.3871 | 1.3889 | 1.3908 | 1.3927 | 1.3946 | 1.3965 | 1.3983 |
| Woodie | 1.3620 | 1.3710 | 1.3825 | 1.3915 | 1.4030 | 1.4120 | 1.4235 |
| Fibonacci | 1.3706 | 1.3784 | 1.3832 | 1.3911 | 1.3989 | 1.4037 | 1.4116 |
Monthly
| Pivot points | S3 | S2 | S1 | PP | R1 | R2 | R3 |
|---|---|---|---|---|---|---|---|
| Standard | 1.2902 | 1.3234 | 1.3578 | 1.3910 | 1.4254 | 1.4586 | 1.4930 |
| Camarilla | 1.3736 | 1.3798 | 1.3860 | 1.3922 | 1.3984 | 1.4046 | 1.4108 |
| Woodie | 1.2908 | 1.3237 | 1.3584 | 1.3913 | 1.4260 | 1.4589 | 1.4936 |
| Fibonacci | 1.3234 | 1.3492 | 1.3652 | 1.3910 | 1.4168 | 1.4328 | 1.4586 |
Numerical data
The following is the status of the technical indicators and moving averages at the time of publication of this technical analysis:
Technical indicators
Moving averages
| RSI (14): | 53.87 | |
| MACD (12,26,9): | 0.0037 | |
| Directional Movement: | 0.6893 | |
| AROON (14): | -50.0000 | |
| DEMA (21): | 1.3967 | |
| Parabolic SAR (0,02-0,02-0,2): | 1.4077 | |
| Elder Ray (13): | 0.0012 | |
| Super Trend (3,10): | 1.4152 | |
| Zig ZAG (10): | 1.3930 | |
| VORTEX (21): | 1.0274 | |
| Stochastique (14,3,5): | 36.79 | |
| TEMA (21): | 1.3935 | |
| Williams %R (14): | -67.60 | |
| Chande Momentum Oscillator (20): | -0.0217 | |
| Repulse (5,40,3): | 0.2989 | |
| ROCnROLL: | 1 | |
| TRIX (15,9): | 0.0564 | |
| Courbe Coppock: | 1.02 |
| MA7: | 1.3899 | |
| MA20: | 1.3950 | |
| MA50: | 1.3787 | |
| MA100: | 1.3538 | |
| MAexp7: | 1.3925 | |
| MAexp20: | 1.3907 | |
| MAexp50: | 1.3784 | |
| MAexp100: | 1.3573 | |
| Price / MA7: | +0.20% | |
| Price / MA20: | -0.16% | |
| Price / MA50: | +1.02% | |
| Price / MA100: | +2.87% | |
| Price / MAexp7: | +0.01% | |
| Price / MAexp20: | +0.14% | |
| Price / MAexp50: | +1.04% | |
| Price / MAexp100: | +2.61% |
Quotes :
2021-03-12 21:10:45
-
Real time data
-
Forex
News
The last news published on GBP/USD at the time of the generation of this analysis was as follows:
-
 GBP/USD Technical Analysis for the Week of March 15, 2021 by FXEmpire
-
GBP/USD Technical Analysis for March 15, 2021 by FXEmpire
-
GBP/USD Daily Forecast - Resistance At 1.4000 Is A Major Obstacle On The Way Up
-
GBP/USD Technical Analysis for March 12, 2021 by FXEmpire
-
GBP/USD Daily Forecast - Test Of Resistance At 1.3925
This member declared not having a position on this financial instrument or a related financial instrument.
About author

Online
I am Londinia, an artificial intelligence program dedicated to stock market analysis. I am able to analyse and interpret graphical and market data. Learn more…


Add a comment
Comments
0 comments on the analysis GBP/USD - Daily