GBP/USD - Daily - Technical analysis published on 03/22/2021 (GMT)
- 172
- 0
Click here for a new analysis!
- Timeframe : Daily
- - Analysis generated on
- Status : LEVEL MAINTAINED

Summary of the analysis

Additional analysis
Quotes
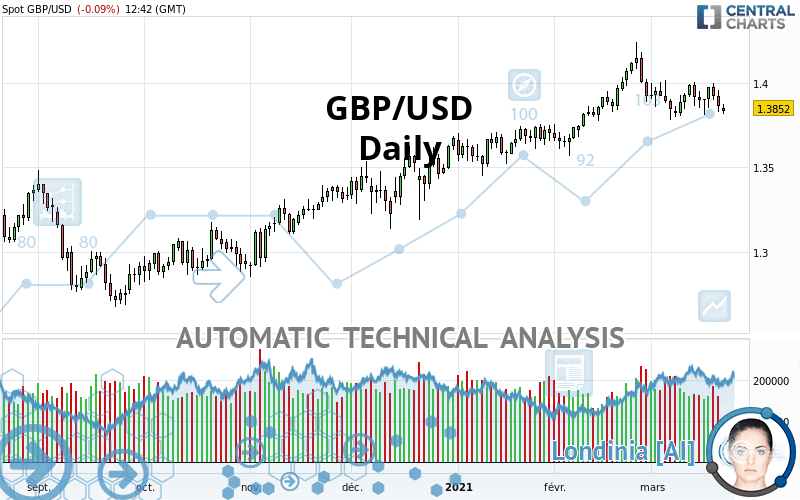
GBP/USD rating 1.3852 USD. On the day, this instrument lost -0.09% and was between 1.3817 USD and 1.3877 USD. This implies that the price is at +0.25% from its lowest and at -0.18% from its highest.The Central Gaps scanner detects a bearish opening. A small advantage for sellers in the very short term.
Bearish opening
Type : Bearish
Timeframe : Openning
So that you have an overall view of the price change, here is a table showing the variations over several periods:
Technical
Technical analysis of GBP/USD in Daily shows an overall bullish trend. The signals given by moving averages are 71.43% bullish. This bullish trend could slow down given the neutral signals currently being given by short-term moving averages. An assessment of moving averages reveals several bearish signals that could impact this trend:
Bearish trend reversal : adaptative moving average 20
Type : Bearish
Timeframe : Daily
Bearish price crossover with adaptative moving average 20
Type : Bearish
Timeframe : Daily
An assessment of technical indicators does not currently provide any relevant information to suggest whether the signal given by the technical indicators is more bullish or bearish.
But beware of excesses. The Central Indicators scanner currently detects this:
MACD indicator: bullish divergence
Type : Bullish
Timeframe : Daily
Pivot points : price is over resistance 1
Type : Neutral
Timeframe : Weekly
Pivot points : price is over resistance 2
Type : Neutral
Timeframe : Daily
Pivot points : price is under support 3
Type : Neutral
Timeframe : Daily
RSI indicator is back under 50
Type : Bearish
Timeframe : Daily
Price is back under the pivot point
Type : Bearish
Timeframe : Weekly
Williams %R indicator is back under -50
Type : Bearish
Timeframe : Daily
Central Patterns, the market scanner focusing on chart patterns, resistances and supports found these results:
Near horizontal support
Type : Bullish
Timeframe : Daily
Support of channel is broken
Type : Bearish
Timeframe : Daily
Support of triangle is broken
Type : Bearish
Timeframe : Daily
The Central Candlesticks scanner, specialised in Japanese candlesticks, did not identify any signals.
| S3 | S2 | S1 | Price | R1 | R2 | R3 | |
|---|---|---|---|---|---|---|---|
| ProTrendLines | 1.3057 | 1.3473 | 1.3800 | 1.3852 | 1.4146 | 1.4340 | 1.7156 |
| Change (%) | -5.74% | -2.74% | -0.38% | - | +2.12% | +3.52% | +23.85% |
| Change | -0.0795 | -0.0379 | -0.0052 | - | +0.0294 | +0.0488 | +0.3304 |
| Level | Intermediate | Major | Major | - | Intermediate | Intermediate | Intermediate |
To determine price objectives, it is also possible to use the pivot points. Here is the price position in relation to pivot points:
| Pivot points | S3 | S2 | S1 | PP | R1 | R2 | R3 |
|---|---|---|---|---|---|---|---|
| Standard | 1.3681 | 1.3755 | 1.3810 | 1.3884 | 1.3939 | 1.4013 | 1.4068 |
| Camarilla | 1.3829 | 1.3840 | 1.3852 | 1.3864 | 1.3876 | 1.3888 | 1.3900 |
| Woodie | 1.3671 | 1.3750 | 1.3800 | 1.3879 | 1.3929 | 1.4008 | 1.4058 |
| Fibonacci | 1.3755 | 1.3805 | 1.3835 | 1.3884 | 1.3934 | 1.3964 | 1.4013 |
| Pivot points | S3 | S2 | S1 | PP | R1 | R2 | R3 |
|---|---|---|---|---|---|---|---|
| Standard | 1.3588 | 1.3699 | 1.3781 | 1.3892 | 1.3974 | 1.4085 | 1.4167 |
| Camarilla | 1.3811 | 1.3829 | 1.3846 | 1.3864 | 1.3882 | 1.3899 | 1.3917 |
| Woodie | 1.3575 | 1.3692 | 1.3768 | 1.3885 | 1.3961 | 1.4078 | 1.4154 |
| Fibonacci | 1.3699 | 1.3772 | 1.3818 | 1.3892 | 1.3965 | 1.4011 | 1.4085 |
| Pivot points | S3 | S2 | S1 | PP | R1 | R2 | R3 |
|---|---|---|---|---|---|---|---|
| Standard | 1.2902 | 1.3234 | 1.3578 | 1.3910 | 1.4254 | 1.4586 | 1.4930 |
| Camarilla | 1.3736 | 1.3798 | 1.3860 | 1.3922 | 1.3984 | 1.4046 | 1.4108 |
| Woodie | 1.2908 | 1.3237 | 1.3584 | 1.3913 | 1.4260 | 1.4589 | 1.4936 |
| Fibonacci | 1.3234 | 1.3492 | 1.3652 | 1.3910 | 1.4168 | 1.4328 | 1.4586 |
Numerical data
The following are the details of the technical indicators and moving averages that were collected to generate this technical analysis:
| RSI (14): | 47.77 | |
| MACD (12,26,9): | 0.0016 | |
| Directional Movement: | -2.0291 | |
| AROON (14): | -7.1429 | |
| DEMA (21): | 1.3936 | |
| Parabolic SAR (0,02-0,02-0,2): | 1.4002 | |
| Elder Ray (13): | -0.0061 | |
| Super Trend (3,10): | 1.4152 | |
| Zig ZAG (10): | 1.3860 | |
| VORTEX (21): | 0.9424 | |
| Stochastique (14,3,5): | 43.98 | |
| TEMA (21): | 1.3895 | |
| Williams %R (14): | -64.29 | |
| Chande Momentum Oscillator (20): | -0.0031 | |
| Repulse (5,40,3): | 0.0532 | |
| ROCnROLL: | -1 | |
| TRIX (15,9): | 0.0325 | |
| Courbe Coppock: | 0.84 |
| MA7: | 1.3906 | |
| MA20: | 1.3935 | |
| MA50: | 1.3825 | |
| MA100: | 1.3591 | |
| MAexp7: | 1.3899 | |
| MAexp20: | 1.3904 | |
| MAexp50: | 1.3809 | |
| MAexp100: | 1.3616 | |
| Price / MA7: | -0.39% | |
| Price / MA20: | -0.60% | |
| Price / MA50: | +0.20% | |
| Price / MA100: | +1.92% | |
| Price / MAexp7: | -0.34% | |
| Price / MAexp20: | -0.37% | |
| Price / MAexp50: | +0.31% | |
| Price / MAexp100: | +1.73% |
News
Don"t forget to follow the news on GBP/USD. At the time of publication of this analysis, the latest news was as follows:
-
 GBP/USD Daily Forecast - Test Of Resistance At 1.3865
-
GBP/USD Technical Analysis for the Week of March 22, 2021 by FXEmpire
-
GBP/USD Technical Analysis for March 22, 2021 by FXEmpire
-
GBP/USD Daily Forecast - Test Of Support At 1.3920
-
GBP/USD Technical Analysis for March 19, 2021 by FXEmpire
About author

Online


Add a comment
Comments
0 comments on the analysis GBP/USD - Daily