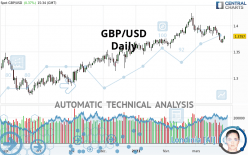
GBP/USD - Daily - Technical analysis published on 03/26/2021 (GMT)
- Who voted?
- 223
- 0
Click here for a new analysis!
- Timeframe : Daily
- - Analysis generated on
- Status : LEVEL MAINTAINED

Summary of the analysis

Additional analysis
Quotes
The GBP/USD rating is 1.3797 USD. The price has increased by +0.37% since the last closing and was between 1.3742 USD and 1.3813 USD. This implies that the price is at +0.40% from its lowest and at -0.12% from its highest.The Central Gaps scanner detects a bullish opening marking the presence of buyers ahead of sellers at the opening but not sufficiently marked to allow the price to register a quotation gap.
Bullish opening
Type : Bullish
Timeframe : Openning
Here is a more detailed summary of the historical variations registered by GBP/USD:
Technical
A technical analysis in Daily of this GBP/USD chart shows a slightly bullish trend. 57.14% of the signals given by moving averages are bullish. Caution: the strong bearish signals currently being given by short-term moving averages indicate that this slightly bullish trend could be reversed. The Central Indicators scanner detects a bullish signal on moving averages that could impact this trend:
Bullish price crossover with adaptative moving average 100
Type : Bullish
Timeframe : Daily
In fact, Central Analyzer took into account 18 technical indicators and the result was as follows: 5 are bullish, 5 are neutral and 8 are bearish. Caution: the Central Indicators scanner currently detects an excess:
CCI indicator is oversold : under -100
Type : Neutral
Timeframe : Daily
Previous candle closed under Bollinger bands
Type : Neutral
Timeframe : Daily
MACD indicator: bullish divergence
Type : Bullish
Timeframe : Daily
Pivot points : price is over resistance 1
Type : Neutral
Timeframe : Weekly
Pivot points : price is over resistance 2
Type : Neutral
Timeframe : Daily
Pivot points : price is under support 3
Type : Neutral
Timeframe : Daily
Pivot points : price is under support 3
Type : Neutral
Timeframe : Weekly
The Central Patterns scanner, which studies chart patterns, resistances and supports, has identified these signals:
Near horizontal support
Type : Bullish
Timeframe : Daily
Support of channel is broken
Type : Bearish
Timeframe : Daily
Support of triangle is broken
Type : Bearish
Timeframe : Daily
For a small rebound in the very short term, the Central Candlesticks scanner currently notes the presence of this bullish pattern in Japanese candlesticks:
Bullish engulfing lines
Type : Bullish
Timeframe : Daily
| S3 | S2 | S1 | Price | R1 | R2 | R3 | |
|---|---|---|---|---|---|---|---|
| ProTrendLines | 1.2704 | 1.3057 | 1.3473 | 1.3797 | 1.3800 | 1.3986 | 1.4146 |
| Change (%) | -7.92% | -5.36% | -2.35% | - | +0.02% | +1.37% | +2.53% |
| Change | -0.1093 | -0.0740 | -0.0324 | - | +0.0003 | +0.0189 | +0.0349 |
| Level | Major | Intermediate | Major | - | Major | Major | Minor |
Attention could also be paid to pivot points to set price objectives:
| Pivot points | S3 | S2 | S1 | PP | R1 | R2 | R3 |
|---|---|---|---|---|---|---|---|
| Standard | 1.3615 | 1.3643 | 1.3694 | 1.3722 | 1.3773 | 1.3801 | 1.3852 |
| Camarilla | 1.3724 | 1.3732 | 1.3739 | 1.3746 | 1.3753 | 1.3761 | 1.3768 |
| Woodie | 1.3628 | 1.3649 | 1.3707 | 1.3728 | 1.3786 | 1.3807 | 1.3865 |
| Fibonacci | 1.3643 | 1.3673 | 1.3692 | 1.3722 | 1.3752 | 1.3771 | 1.3801 |
| Pivot points | S3 | S2 | S1 | PP | R1 | R2 | R3 |
|---|---|---|---|---|---|---|---|
| Standard | 1.3588 | 1.3699 | 1.3781 | 1.3892 | 1.3974 | 1.4085 | 1.4167 |
| Camarilla | 1.3811 | 1.3829 | 1.3846 | 1.3864 | 1.3882 | 1.3899 | 1.3917 |
| Woodie | 1.3575 | 1.3692 | 1.3768 | 1.3885 | 1.3961 | 1.4078 | 1.4154 |
| Fibonacci | 1.3699 | 1.3772 | 1.3818 | 1.3892 | 1.3965 | 1.4011 | 1.4085 |
| Pivot points | S3 | S2 | S1 | PP | R1 | R2 | R3 |
|---|---|---|---|---|---|---|---|
| Standard | 1.2902 | 1.3234 | 1.3578 | 1.3910 | 1.4254 | 1.4586 | 1.4930 |
| Camarilla | 1.3736 | 1.3798 | 1.3860 | 1.3922 | 1.3984 | 1.4046 | 1.4108 |
| Woodie | 1.2908 | 1.3237 | 1.3584 | 1.3913 | 1.4260 | 1.4589 | 1.4936 |
| Fibonacci | 1.3234 | 1.3492 | 1.3652 | 1.3910 | 1.4168 | 1.4328 | 1.4586 |
Numerical data
The following is the status of the technical indicators and moving averages at the time of publication of this technical analysis:
| RSI (14): | 45.57 | |
| MACD (12,26,9): | -0.0024 | |
| Directional Movement: | -4.9916 | |
| AROON (14): | -64.2857 | |
| DEMA (21): | 1.3836 | |
| Parabolic SAR (0,02-0,02-0,2): | 1.3906 | |
| Elder Ray (13): | -0.0056 | |
| Super Trend (3,10): | 1.4014 | |
| Zig ZAG (10): | 1.3797 | |
| VORTEX (21): | 0.8811 | |
| Stochastique (14,3,5): | 22.61 | |
| TEMA (21): | 1.3774 | |
| Williams %R (14): | -59.40 | |
| Chande Momentum Oscillator (20): | -0.0126 | |
| Repulse (5,40,3): | 0.4139 | |
| ROCnROLL: | -1 | |
| TRIX (15,9): | 0.0031 | |
| Courbe Coppock: | 1.51 |
| MA7: | 1.3802 | |
| MA20: | 1.3873 | |
| MA50: | 1.3833 | |
| MA100: | 1.3621 | |
| MAexp7: | 1.3798 | |
| MAexp20: | 1.3850 | |
| MAexp50: | 1.3799 | |
| MAexp100: | 1.3625 | |
| Price / MA7: | -0.04% | |
| Price / MA20: | -0.55% | |
| Price / MA50: | -0.26% | |
| Price / MA100: | +1.29% | |
| Price / MAexp7: | -0.01% | |
| Price / MAexp20: | -0.38% | |
| Price / MAexp50: | -0.01% | |
| Price / MAexp100: | +1.26% |
News
The latest news and videos published on GBP/USD at the time of the analysis were as follows:
-
 GBP/USD Technical Analysis for the Week of March 29, 2021 by FXEmpire
-
GBP/USD Technical Analysis for March 29, 2021 by FXEmpire
-
GBP/USD Daily Forecast - Resistance At 1.3780 In Sight
-
GBP/USD Technical Analysis for March 26, 2021 by FXEmpire
-
GBP/USD Daily Forecast - U.S. Dollar Tries To Gain More Ground Against British Pound
About author

Online


Add a comment
Comments
0 comments on the analysis GBP/USD - Daily