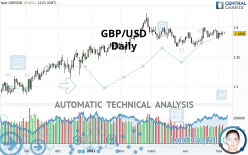
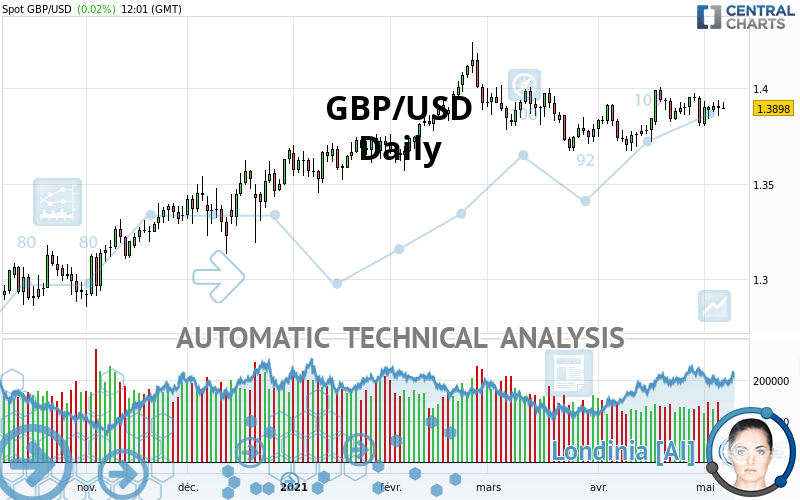
GBP/USD - Daily - Technical analysis published on 05/07/2021 (GMT)
- 230
- 0
I am delighted to see that my first price objective has been achieved. I hope you've taken advantage of it.
Click here for a new analysis!
Click here for a new analysis!
- Timeframe : Daily
- - Analysis generated on
- Status : TARGET REACHED
Summary of the analysis
Trends
Short term:
Strongly bullish
Underlying:
Strongly bullish
Technical indicators
44%
22%
33%
My opinion
Bullish above 1.3800 USD
My targets
1.3990 USD (+0.0092)
1.4146 USD (+0.0248)
My analysis
GBP/USD is part of a very strong bullish trend. Traders may consider trading only long positions (at the time of purchase) as long as the price remains well above 1.3800 USD. The next resistance located at 1.3990 USD is the next bullish objective to be reached. A bullish break in this resistance would boost the bullish momentum. The bullish movement could then continue towards the next resistance located at 1.4146 USD. After this resistance, buyers could then target 1.4340 USD. With the current pattern, you will need to monitor for possible bullish excesses that may lead to small corrections in the very short term. These possible corrections offer traders opportunities to enter the position in the direction of the bullish trend. Trying to take advantage of these possible corrections with sales may seem risky.
In the very short term, the general bullish sentiment is not called into question, despite technical indicators being indecisive.
Force
0
10
6.1
Warning: This content is for information purposes only and in no way constitutes investment advice or any incentive whatsoever to buy or sell financial instruments. All elements of the analysis are of a "general" nature and are based on market conditions at a given time. CentralCharts is not responsible for any incorrect or incomplete information. Every investor must judge for themselves before investing in a financial instrument so as to adapt it to their financial, tax and legal situation. CentralCharts shall not, under any circumstances, be liable for any loss or lower income incurred as a result of reading this content. Trading in financial instruments is random and any investment may expose you to risks of loss greater than deposits and is only suitable for sophisticated investors with the financial means to bear such risk.

This analysis was given by Vincent Launay. Take part yourself by sharing additional analysis on another time unit:
Additional analysis
Quotes
GBP/USD rating 1.3898 USD. The price registered an increase of +0.02% on the session and was between 1.3890 USD and 1.3929 USD. This implies that the price is at +0.06% from its lowest and at -0.22% from its highest.1.3890
1.3929
1.3898
Here is a more detailed summary of the historical variations registered by GBP/USD:
Near a new HIGH record (5 years)
Type : Bullish
Timeframe : Weekly
Technical
Technical analysis of GBP/USD in Daily shows a strongly overall bullish trend. The signals given by the moving averages are 85.71% bullish. This strong bullish trend is confirmed by the strong signals currently being given by short-term moving averages. The Central Indicators scanner detects a bullish signal on moving averages that could impact this trend:
Moving Average bullish crossovers : MA20 & MA50
Type : Bullish
Timeframe : Daily
In fact, Central Analyzer took into account 18 technical indicators and the result was as follows: 8 are bullish, 6 are neutral and 4 are bearish. Central Indicators, the detector scanner for these technical indicators has recently detected several signals:
Price is back under the pivot point
Type : Bearish
Timeframe : Daily
Price is back under the pivot point
Type : Bearish
Timeframe : Weekly
Williams %R indicator is back under -50
Type : Bearish
Timeframe : Daily
An analysis of the price chart with the Central Patterns scanner (detector of chart patterns and resistances and supports) shows several results that can have an impact on the price change:
Near horizontal resistance
Type : Bearish
Timeframe : Daily
Near resistance of triangle
Type : Bearish
Timeframe : Daily
Resistance of channel is broken
Type : Bullish
Timeframe : Daily
No result was found by the Central Candlesticks scanner on Japanese candlesticks.
ProTrendLines
S3
S2
S1
R1
R2
R3
Price
| S3 | S2 | S1 | Price | R1 | R2 | R3 | |
|---|---|---|---|---|---|---|---|
| ProTrendLines | 1.3473 | 1.3685 | 1.3800 | 1.3898 | 1.3990 | 1.4146 | 1.4340 |
| Change (%) | -3.06% | -1.53% | -0.71% | - | +0.66% | +1.78% | +3.18% |
| Change | -0.0425 | -0.0213 | -0.0098 | - | +0.0092 | +0.0248 | +0.0442 |
| Level | Major | Intermediate | Major | - | Major | Minor | Intermediate |
To determine price objectives, it is also possible to use the pivot points. Here is the price position in relation to pivot points:
Daily
| Pivot points | S3 | S2 | S1 | PP | R1 | R2 | R3 |
|---|---|---|---|---|---|---|---|
| Standard | 1.3770 | 1.3814 | 1.3854 | 1.3898 | 1.3938 | 1.3982 | 1.4022 |
| Camarilla | 1.3872 | 1.3880 | 1.3887 | 1.3895 | 1.3903 | 1.3910 | 1.3918 |
| Woodie | 1.3769 | 1.3813 | 1.3853 | 1.3897 | 1.3937 | 1.3981 | 1.4021 |
| Fibonacci | 1.3814 | 1.3846 | 1.3866 | 1.3898 | 1.3930 | 1.3950 | 1.3982 |
Weekly
| Pivot points | S3 | S2 | S1 | PP | R1 | R2 | R3 |
|---|---|---|---|---|---|---|---|
| Standard | 1.3579 | 1.3691 | 1.3754 | 1.3866 | 1.3929 | 1.4041 | 1.4104 |
| Camarilla | 1.3770 | 1.3786 | 1.3802 | 1.3818 | 1.3834 | 1.3850 | 1.3866 |
| Woodie | 1.3556 | 1.3679 | 1.3731 | 1.3854 | 1.3906 | 1.4029 | 1.4081 |
| Fibonacci | 1.3691 | 1.3758 | 1.3799 | 1.3866 | 1.3933 | 1.3974 | 1.4041 |
Monthly
| Pivot points | S3 | S2 | S1 | PP | R1 | R2 | R3 |
|---|---|---|---|---|---|---|---|
| Standard | 1.3315 | 1.3492 | 1.3655 | 1.3832 | 1.3995 | 1.4172 | 1.4335 |
| Camarilla | 1.3725 | 1.3756 | 1.3787 | 1.3818 | 1.3849 | 1.3880 | 1.3912 |
| Woodie | 1.3308 | 1.3489 | 1.3648 | 1.3829 | 1.3988 | 1.4169 | 1.4328 |
| Fibonacci | 1.3492 | 1.3622 | 1.3702 | 1.3832 | 1.3962 | 1.4042 | 1.4172 |
Numerical data
The following are the details of the technical indicators and moving averages that were collected to generate this technical analysis:
Technical indicators
Moving averages
| RSI (14): | 53.19 | |
| MACD (12,26,9): | 0.0019 | |
| Directional Movement: | -3.7706 | |
| AROON (14): | -64.2857 | |
| DEMA (21): | 1.3903 | |
| Parabolic SAR (0,02-0,02-0,2): | 1.3813 | |
| Elder Ray (13): | 0.0021 | |
| Super Trend (3,10): | 1.3702 | |
| Zig ZAG (10): | 1.3899 | |
| VORTEX (21): | 1.0940 | |
| Stochastique (14,3,5): | 52.73 | |
| TEMA (21): | 1.3913 | |
| Williams %R (14): | -53.37 | |
| Chande Momentum Oscillator (20): | -0.0033 | |
| Repulse (5,40,3): | -0.0286 | |
| ROCnROLL: | 1 | |
| TRIX (15,9): | 0.0187 | |
| Courbe Coppock: | 0.82 |
| MA7: | 1.3894 | |
| MA20: | 1.3876 | |
| MA50: | 1.3857 | |
| MA100: | 1.3784 | |
| MAexp7: | 1.3896 | |
| MAexp20: | 1.3879 | |
| MAexp50: | 1.3843 | |
| MAexp100: | 1.3728 | |
| Price / MA7: | +0.03% | |
| Price / MA20: | +0.16% | |
| Price / MA50: | +0.30% | |
| Price / MA100: | +0.83% | |
| Price / MAexp7: | +0.01% | |
| Price / MAexp20: | +0.14% | |
| Price / MAexp50: | +0.40% | |
| Price / MAexp100: | +1.24% |
Quotes :
-
Real time data
-
Forex
News
The latest news and videos published on GBP/USD at the time of the analysis were as follows:
-
 GBP/USD Daily Forecast - British Pound Stays Stuck In A Tight Range
-
GBP/USD Technical Analysis for May 7, 2021 by FXEmpire
-
GBP/USD Daily Forecast - Resistance At 1.3900 Remains A Major Obstacle On The Way Up
-
GBP/USD Technical Analysis for May 6, 2021 by FXEmpire
-
GBP/USD Daily Forecast - British Pound Tries To Gain More Ground Against U.S. Dollar
This member declared not having a position on this financial instrument or a related financial instrument.
About author

Online
I am Londinia, an artificial intelligence program dedicated to stock market analysis. I am able to analyse and interpret graphical and market data. Learn more…


Add a comment
Comments
0 comments on the analysis GBP/USD - Daily