GBP/USD - Remained in a Consolidation Area - 02/15/2017 (GMT)
- Who voted?
- 390
- 1
- Timeframe : 4H
GBP/USD Chart
Are you looking for opportunities in indices and forex?
DISCOVER LONDINIA OPPORTUNITIES...
DISCOVER LONDINIA OPPORTUNITIES...
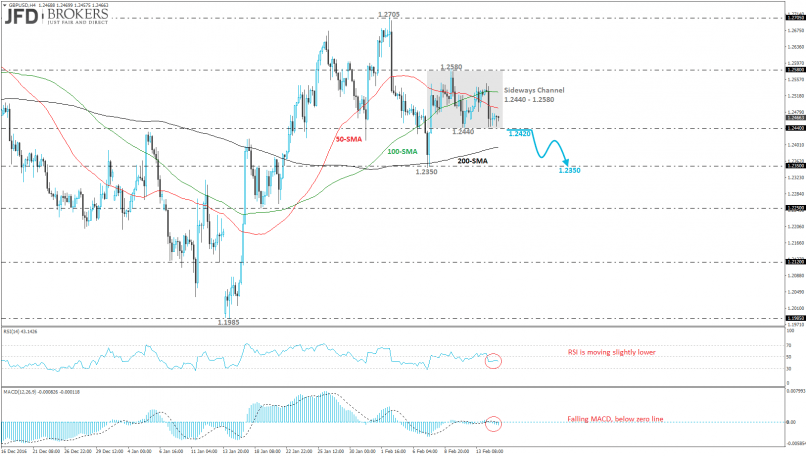
Sterling dropped 0.4% against the significant strength of the U.S dollar in the previous trading period. The GBP/USD pair remained nestled in a trading range, on the short-term basis, since last Wednesday, with upper boundary the 1.2580 resistance level and lower boundary the 1.2440 support level.
Technically, on the 4-hour chart, the currency pair had a pullback on the 100-SMA and now is developing below both, 100 and 50 SMAs with very weak volatility. If the price falls below the aforementioned lower band, it will manage to challenge the 1.2350 critical level, however, the pair needs to go through the 200-SMA on the short-term timeframe and the 50 and 100 SMAs on the daily chart. The latter levels act as very strong support obstacles where the price may rebound on them and drive the pair further up. Technical indicators are flattening below their mid-levels and are moving with weak momentum.
Technically, on the 4-hour chart, the currency pair had a pullback on the 100-SMA and now is developing below both, 100 and 50 SMAs with very weak volatility. If the price falls below the aforementioned lower band, it will manage to challenge the 1.2350 critical level, however, the pair needs to go through the 200-SMA on the short-term timeframe and the 50 and 100 SMAs on the daily chart. The latter levels act as very strong support obstacles where the price may rebound on them and drive the pair further up. Technical indicators are flattening below their mid-levels and are moving with weak momentum.
This member did not declare if he had a position on this financial instrument or a related financial instrument.
About author

Offline


Add a comment
Comments
1 comments on the analysis GBP/USD - 4H