GBP/USD - Fell After the Sharp Upward Move - Target Locked at 1.2780! - 04/20/2017 (GMT)
- Who voted?
- 380
- 0
- Timeframe : 4H
GBP/USD Chart
Are you looking for opportunities in indices and forex?
DISCOVER LONDINIA OPPORTUNITIES...
DISCOVER LONDINIA OPPORTUNITIES...
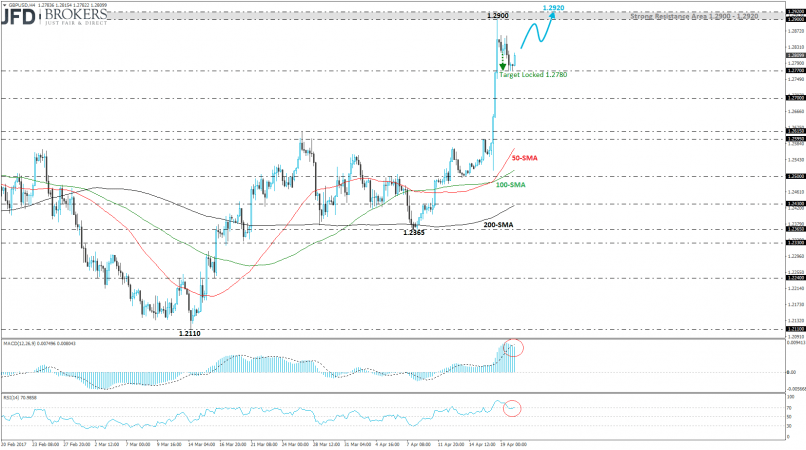
After Tuesday’s aggressive run, the GBP/USD pair failed to extend its gains on Wednesday. Sterling traded lower against the U.S. dollar and hit our recommended support level at 1.2780 (see technical analysis here: http://bit.ly/2pzlY1I) and the price is continuing for the second suggested target at 1.2920 resistance barrier. Yesterday’s move was a combination of profit taking and dollar strength. Moreover, the retracement is due to the strong resistance level, 50-weekly SMA, near 1.2870.
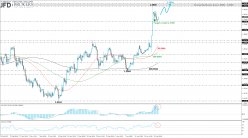
Technically, the cable climbed more than 2% in April and broke to the upside the medium-term trading range with lower boundary the 1.1978 and upper boundary the 1.2700 key level. Technical indicators on the medium-term timeframe are signalling for further upside movement with strong momentum while on the 4-hour chart, the MACD oscillator is falling in the overbought area and the RSI is sloping to the upside above the 70 level.
Technically, the cable climbed more than 2% in April and broke to the upside the medium-term trading range with lower boundary the 1.1978 and upper boundary the 1.2700 key level. Technical indicators on the medium-term timeframe are signalling for further upside movement with strong momentum while on the 4-hour chart, the MACD oscillator is falling in the overbought area and the RSI is sloping to the upside above the 70 level.
This member did not declare if he had a position on this financial instrument or a related financial instrument.
About author

Offline


Add a comment
Comments
0 comments on the analysis GBP/USD - 4H