GBP/USD - Has Been Choppy - Next Support Level 1.2850 - 05/09/2017 (GMT)
- Who voted?
- 457
- 0
- Timeframe : 4H
GBP/USD Chart
Are you looking for opportunities in indices and forex?
DISCOVER LONDINIA OPPORTUNITIES...
DISCOVER LONDINIA OPPORTUNITIES...
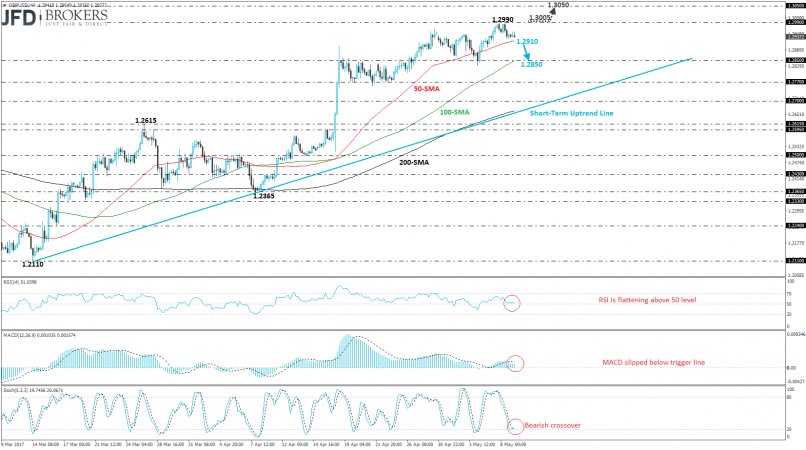
The GBP/USD pair had a fairly directionless movement as the last couple of hours the price is moving sideways. Sterling completed the second consecutive bear session against the greenback whilst is approaching the 50-SMA on the 4-hour chart. If the price slips below the latter level, it will open the door for the 1.2850 support obstacle which overlaps with the 100-SMA on the 4-hour chart. Additionally, going to the daily timeframe, the price is developing within an uptrend since mid-March and if there is an aggressive run above 1.2990, the pair will meet the 1.3050 resistance level.
The Relative Strength Index (RSI) is holding slightly above the 50 level with weak momentum as well as the MACD oscillator which fell beneath the trigger line. The stochastic oscillator created a bearish crossover with is moving averages in the bearish territory.
The Relative Strength Index (RSI) is holding slightly above the 50 level with weak momentum as well as the MACD oscillator which fell beneath the trigger line. The stochastic oscillator created a bearish crossover with is moving averages in the bearish territory.
This member did not declare if he had a position on this financial instrument or a related financial instrument.
About author

Offline


Add a comment
Comments
0 comments on the analysis GBP/USD - 4H