GBP/USD - Tricked Traders Rising Above 1.3000 - 05/19/2017 (GMT)
- Who voted?
- 450
- 0
- Timeframe : 4H
GBP/USD Chart
Are you looking for opportunities in indices and forex?
DISCOVER LONDINIA OPPORTUNITIES...
DISCOVER LONDINIA OPPORTUNITIES...
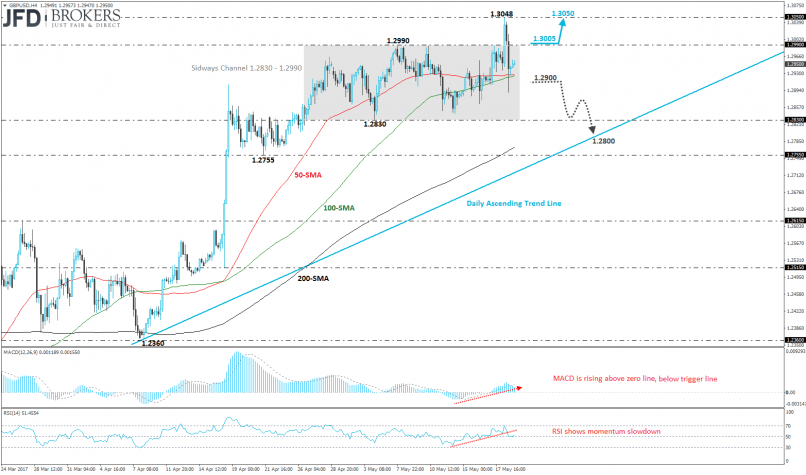
The GBP/USD gained momentum from the strong U.K. retail sales during the European session, exited the sideways channel with upper boundary 1.2990 and lower boundary 1.2830, and topped at 1.3048, eight-month high and just two pips below our recommended target (see yesterday analysis: http://bit.ly/2rtUmsZ ). However, in the Asian session, it lost all its gains and ended slightly above the 50 and 100-SMAs on the 4-hour chart. The pair needs a decisive break out of this channel to determine its direction. A daily close above that area will send the pair to fresh highs above 1.3050.
Looking on the short-term timeframe, we would expect the currency pair to test once more 1.2990 and if the bulls manage to push it higher, it will test again the significant barrier of 1.3050. On the other hand, if the weakness dominates, a slip below the two aforementioned SMAs and 1.2900, will lead the pair to meet its rising trendline near 1.2800.
On the hourly chart, the technical oscillators support our bullish expectation. MACD crossed above its trigger line, in the negative area, and is rising at a slow pace towards zero line while RSI is rising near 50 level. However, on the 4-hour chart, both oscillators are directionless with RSI being flat on the 50 level and MACD developing below trigger line, in the positive area.
This member did not declare if he had a position on this financial instrument or a related financial instrument.
About author

Offline


Add a comment
Comments
0 comments on the analysis GBP/USD - 4H