GBP/USD - Has Been Choppy and Fairly Directionless - Failed to Jump Above 1.3 - 05/23/2017 (GMT)
- Who voted?
- 378
- 0
- Timeframe : Daily
GBP/USD Chart
Are you looking for opportunities in indices and forex?
DISCOVER LONDINIA OPPORTUNITIES...
DISCOVER LONDINIA OPPORTUNITIES...
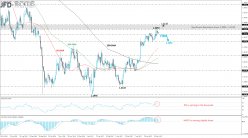
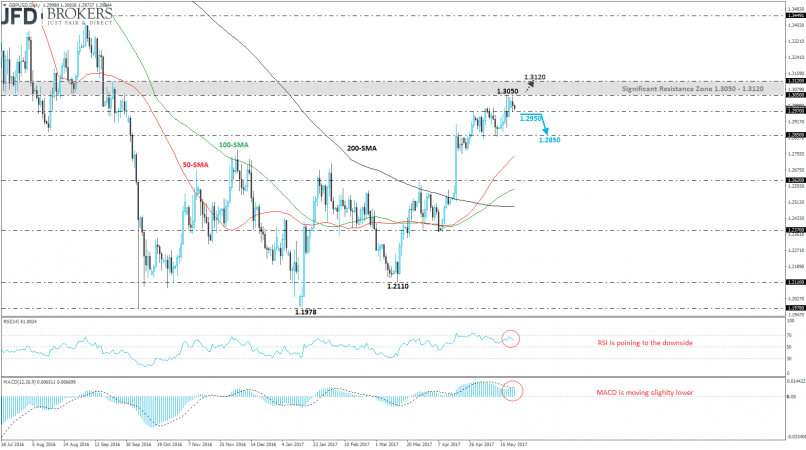
Sterling underperformed yesterday against the greenback as it failed once again to meet and surpass the 1.3050 significant resistance level. In the previous quiet daily trading periods, the GBP/USD pair opened with a gap down ahead of the British general elections on June 8.
The gap down drove the pair lower and is ready to challenge the 1.2970 support level. If the price drops beneath the latter level, it will move lower at 1.2850 but it needs to go through the 50 and 100 SMAs on the 4-hour chart. On the other side, a jump above the 1.3050 resistance handle will drive the cable until the 1.3120 barrier. On the daily chart, the RSI indicator is falling near the 50 level while the MACD oscillator will create a bearish crossover with its trigger line.
The gap down drove the pair lower and is ready to challenge the 1.2970 support level. If the price drops beneath the latter level, it will move lower at 1.2850 but it needs to go through the 50 and 100 SMAs on the 4-hour chart. On the other side, a jump above the 1.3050 resistance handle will drive the cable until the 1.3120 barrier. On the daily chart, the RSI indicator is falling near the 50 level while the MACD oscillator will create a bearish crossover with its trigger line.
This member did not declare if he had a position on this financial instrument or a related financial instrument.
About author

Offline


Add a comment
Comments
0 comments on the analysis GBP/USD - Daily