GBP/USD - Fell Sharply and Broke the Short-Term Rising Trend Line - 05/26/2017 (GMT)
- Who voted?
- 414
- 0
- Timeframe : Daily
GBP/USD Chart
Are you looking for opportunities in indices and forex?
DISCOVER LONDINIA OPPORTUNITIES...
DISCOVER LONDINIA OPPORTUNITIES...
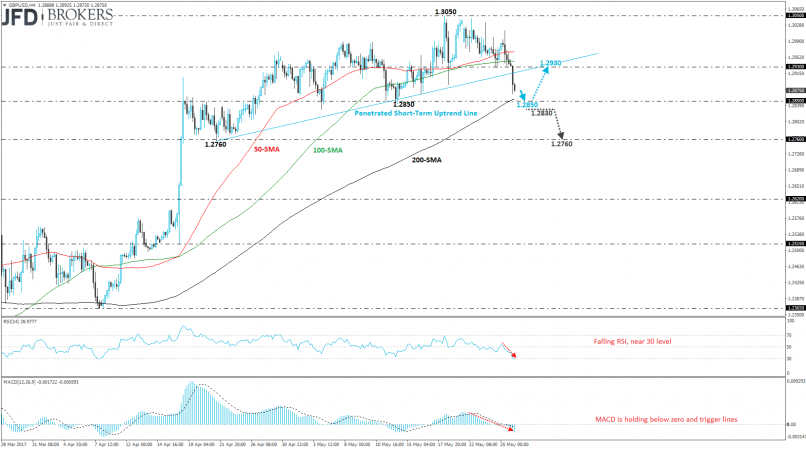
Sterling started the day with an aggressive sell-off against the greenback as it plunged more than 0.7% since Thursday. The GBP/USD pair is completing the second red day in a row and broke to the downside the short-term ascending trend line that was holding since April 21st. In addition, the price exited from the consolidation area at 1.2930 – 1.3050 that was standing the last seven days and is moving towards the 1.2850 support handle which overlaps with the 200-SMA on the 4-hour chart. A run below the latter level will open the way for a test of the 1.2760 barrier. However, the 200-SMA is acting as a strong support obstacle and the price may rebound on it and move higher.
The technical structure suggests further bearish movement for the moment as the technical indicators dropped into the oversold areas. The Relative Strength Index (RSI) hit the 30 level and is strengthening to the downside whilst the MACD oscillator fell below the trigger line after it created a downward crossover.
The technical structure suggests further bearish movement for the moment as the technical indicators dropped into the oversold areas. The Relative Strength Index (RSI) hit the 30 level and is strengthening to the downside whilst the MACD oscillator fell below the trigger line after it created a downward crossover.
This member did not declare if he had a position on this financial instrument or a related financial instrument.
About author

Offline


Add a comment
Comments
0 comments on the analysis GBP/USD - Daily