GBP/USD - Climbed Slightly Higher and Hit Our Suggested Level! - 06/28/2017 (GMT)
- Who voted?
- 319
- 0
- Timeframe : Daily
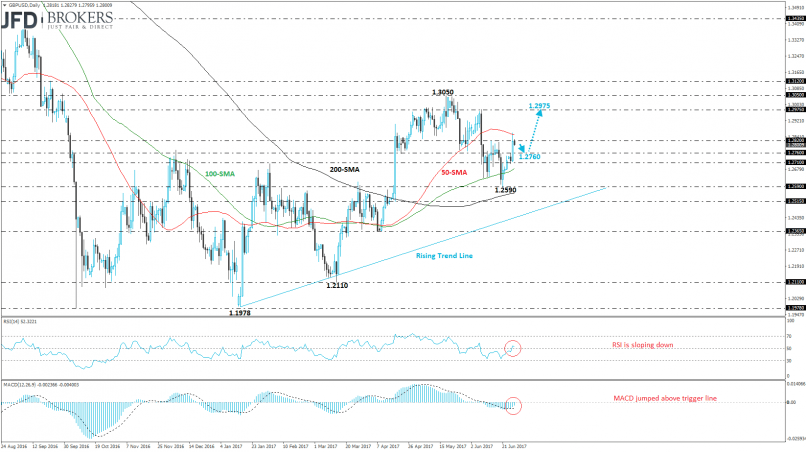
GBP/USD Chart
Are you looking for opportunities in indices and forex?
DISCOVER LONDINIA OPPORTUNITIES...
DISCOVER LONDINIA OPPORTUNITIES...
The cable inclined 0.7% during Tuesday’s trading period following the bounce off the 1.2710 support barrier. The GBP/USD pair managed to challenge our suggested target at 1.2820 (see our technical analysis here: http://bit.ly/2tiYlMg) and jumped slightly higher at 1.2860, three week-high, hitting the 50-day SMA. Our expectation is a small downward retracement until the 1.2760 support barrier before continues its bullish movement. The technical indicators turned into bullish mode, however, the RSI indicator is now sloping to the downside. The MACD oscillator climbed above its trigger line but is still moving in the bearish territory.
This member did not declare if he had a position on this financial instrument or a related financial instrument.
About author

Offline


Add a comment
Comments
0 comments on the analysis GBP/USD - Daily