GBP/USD - Tried Several Times to Surpass 1.2980 Key Level - Neutral Bias - 09/04/2017 (GMT)
- Who voted?
- 293
- 0
- Timeframe : Daily
GBP/USD Chart
Are you looking for opportunities in indices and forex?
DISCOVER LONDINIA OPPORTUNITIES...
DISCOVER LONDINIA OPPORTUNITIES...
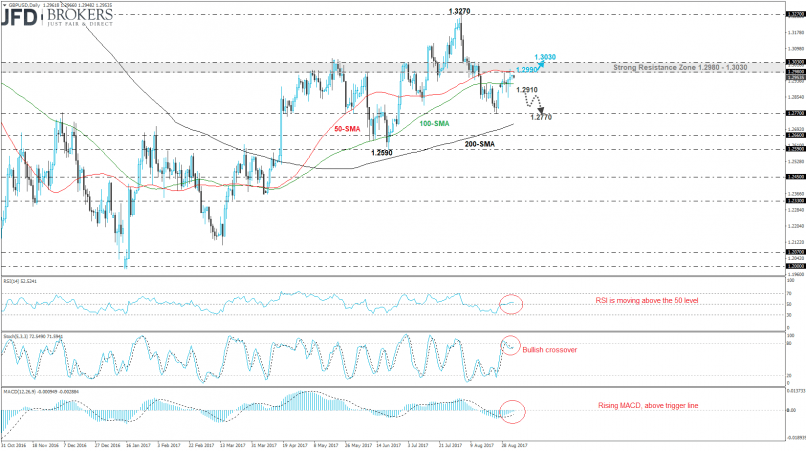
The GBP/USD pair posted the second bullish week in a row after the rebound on the 1.2770 strong support level, however, it remains under pressure. Over the previous week, the cable tried several times to surpass the 1.2980 resistance level but the 50-day SMA is acting as a strong obstacle for the bulls. On a long-term timeframe, the cable plummeted more than 2% the prior month and snapped the two previous winning sessions.
From the technical point of view, on the daily timeframe, the indicators are biased slightly higher. The RSI indicator rose above the 30 level with weak momentum, whilst the MACD oscillator is strengthening below the zero and trigger lines. Also, the stochastic oscillator posted a bullish crossover with its moving averages. The next level to watch if the price jump above 1.2980 would be the 1.3030 resistance handle or moreover the 1.3270 barrier. On the other side, the price will fall again until the 1.2770 support level.
From the technical point of view, on the daily timeframe, the indicators are biased slightly higher. The RSI indicator rose above the 30 level with weak momentum, whilst the MACD oscillator is strengthening below the zero and trigger lines. Also, the stochastic oscillator posted a bullish crossover with its moving averages. The next level to watch if the price jump above 1.2980 would be the 1.3030 resistance handle or moreover the 1.3270 barrier. On the other side, the price will fall again until the 1.2770 support level.
This member did not declare if he had a position on this financial instrument or a related financial instrument.
About author

Offline


Add a comment
Comments
0 comments on the analysis GBP/USD - Daily