GBP/USD - GBP/USD Struggles Beneath the 15-Month High and Lost Some Ground - 09/20/2017 (GMT)
- Who voted?
- 330
- 0
- Timeframe : Daily
GBP/USD Chart
Are you looking for opportunities in indices and forex?
DISCOVER LONDINIA OPPORTUNITIES...
DISCOVER LONDINIA OPPORTUNITIES...
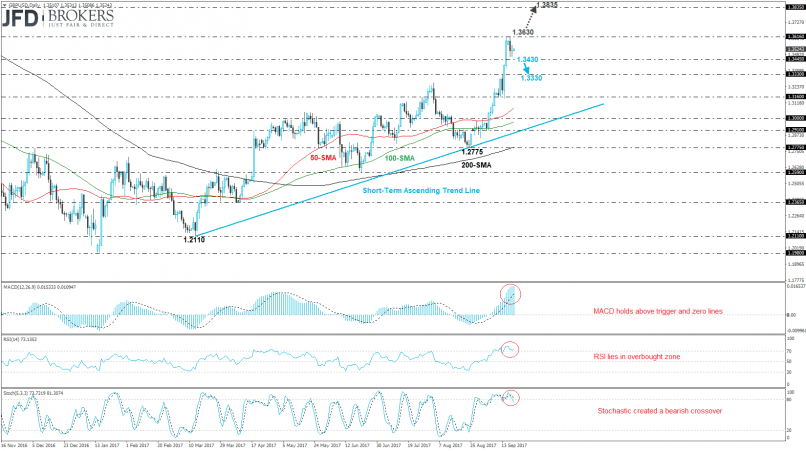
Sterling lost some gains of the previous aggressive bullish run against the greenback following the pullback on the 15-month high at 1.3616. The GBP/USD pair added more than 4.6% so far this month, while this week is snapping four consecutive winning sessions, posting a negative week. Now, the cable is developing within the 1.3445 – 1.3616 area and we are expecting for a penetration in either direction to have a clear continuation of the trend.
On the short-term chart, the MACD oscillator is standing above the trigger line, whilst the RSI indicator lies in the overbought zone. Also, the stochastic oscillator posted a bearish crossover with its moving averages in the overbought zone, indicating a bearish movement.
On the short-term chart, the MACD oscillator is standing above the trigger line, whilst the RSI indicator lies in the overbought zone. Also, the stochastic oscillator posted a bearish crossover with its moving averages in the overbought zone, indicating a bearish movement.
This member declared not having a position on this financial instrument or a related financial instrument.
About author

Offline


Add a comment
Comments
0 comments on the analysis GBP/USD - Daily