GBP/USD - GBP/USD Has Weak Movement The Last 2 Days - Neutral Bias - 09/21/2017 (GMT)
- Who voted?
- 394
- 0
- Timeframe : Daily
GBP/USD Chart
Are you looking for opportunities in indices and forex?
DISCOVER LONDINIA OPPORTUNITIES...
DISCOVER LONDINIA OPPORTUNITIES...
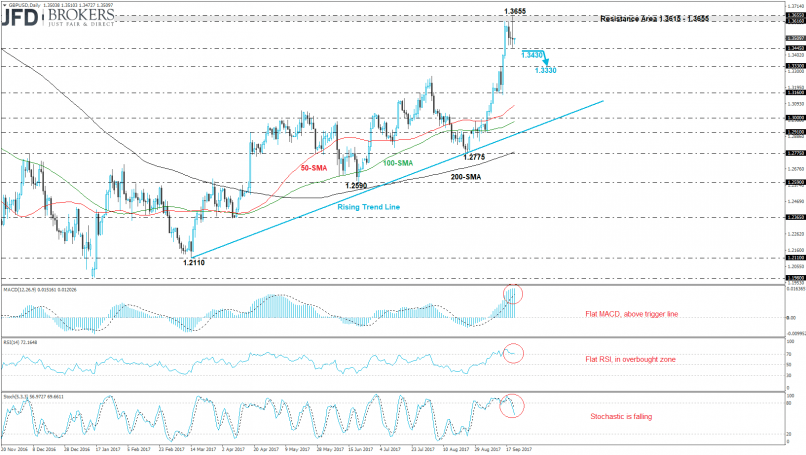
Over the last three trading days, the cable ends the sessions near its opening levels, indicating weak momentum expanding its gains. During yesterday’s period, the GBP/USD pair broke above the 1.3616 and challenged a new 15-month high at 1.3655 due to stronger than expected retail sales. However, the price settled the day near the 1.3500 psychological level. Monthly, the price soared more than 4.4% following the rebound on 1.2910 support barrier.
Technically, on the daily chart, the MACD oscillator is flattening in the overbought area as well as the RSI indicator. On the other side, the stochastic oscillator is falling. The technical indicators are signalling for a pause of the upward movement and maybe is the time for a retracement. The next level to watch to the downside is the 1.3330 handle.
Technically, on the daily chart, the MACD oscillator is flattening in the overbought area as well as the RSI indicator. On the other side, the stochastic oscillator is falling. The technical indicators are signalling for a pause of the upward movement and maybe is the time for a retracement. The next level to watch to the downside is the 1.3330 handle.
This member declared not having a position on this financial instrument or a related financial instrument.
About author

Offline


Add a comment
Comments
0 comments on the analysis GBP/USD - Daily