GBP/USD - Posted an Aggressive Bearish Run - Next Level to Have in Mind 1.316 - 10/03/2017 (GMT)
- Who voted?
- 386
- 0
- Timeframe : Daily
GBP/USD Chart
Are you looking for opportunities in indices and forex?
DISCOVER LONDINIA OPPORTUNITIES...
DISCOVER LONDINIA OPPORTUNITIES...
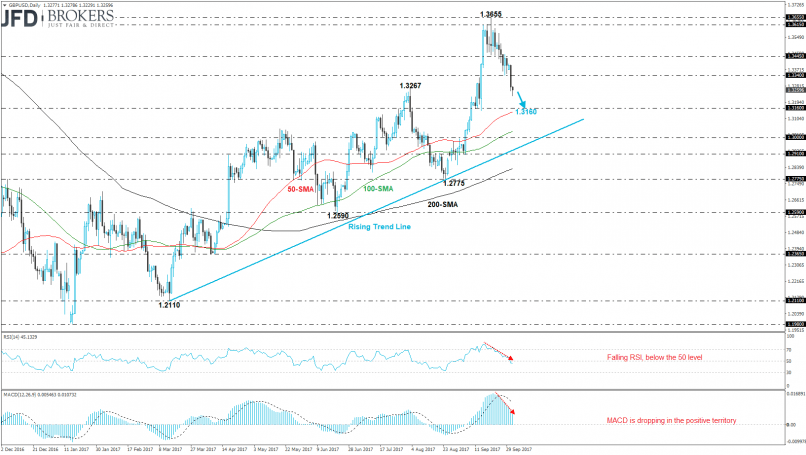
Sterling completed an aggressive bearish day against the greenback, plunging 0.9% in just one trading period. On a weekly basis, the cable is recording the third straight negative week and sank below the 100-SMA. The GBP/USD pair finally fell below the 1.3340 strong handle and now is approaching the next immediate support at 1.3160, which is slightly above the 50-day SMA.
From the technical point of view, the RSI indicator after the bounce off the overbought zone started a falling move and entered the bearish area. Additionally, the MACD oscillator has a strong bearish momentum as it fell below the trigger line.
From the technical point of view, the RSI indicator after the bounce off the overbought zone started a falling move and entered the bearish area. Additionally, the MACD oscillator has a strong bearish momentum as it fell below the trigger line.
This member declared not having a position on this financial instrument or a related financial instrument.
About author

Offline


Add a comment
Comments
0 comments on the analysis GBP/USD - Daily