GBP/USD - Is Approaching the 1.3000 Key Level - Plunged 1.3% in November So Far - 11/14/2017 (GMT)
- Who voted?
- 252
- 0
- Timeframe : Daily
GBP/USD Chart
Are you looking for opportunities in indices and forex?
DISCOVER LONDINIA OPPORTUNITIES...
DISCOVER LONDINIA OPPORTUNITIES...
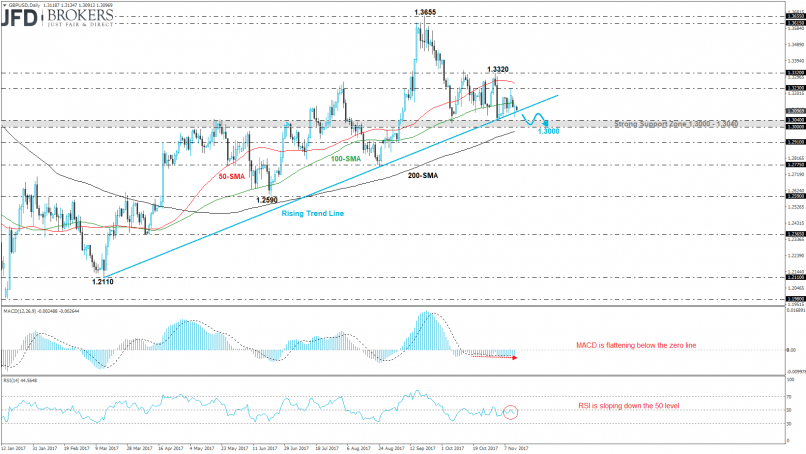
Sterling printed a slightly positive week versus the greenback, however, the GBP/USD pair is creating a negative month. The cable plummeted more than 1.3% so far this month and challenged several times the rising trend line over the last days. The next levels to have in mind is the significant support area 1.3000 – 1.3040 if the price breaks the diagonal line to the downside.
During yesterday’s trading period, the price tried to break to the downside the aforementioned obstacle but failed to end the day below it. Technically, on the daily timeframe, the price is developing well below the 50-SMA and the 100-SMA, while they are sloping to the downside. The MACD oscillator is flattening in the negative territory with weak momentum, while the RSI indicator is pointing down after the strong rebound on the 50 level.
During yesterday’s trading period, the price tried to break to the downside the aforementioned obstacle but failed to end the day below it. Technically, on the daily timeframe, the price is developing well below the 50-SMA and the 100-SMA, while they are sloping to the downside. The MACD oscillator is flattening in the negative territory with weak momentum, while the RSI indicator is pointing down after the strong rebound on the 50 level.
This member declared not having a position on this financial instrument or a related financial instrument.
About author

Offline


Add a comment
Comments
0 comments on the analysis GBP/USD - Daily