GBP/USD - Holds Above the Ascending Trend Line - Next Bullish Target 1.3230 - 11/15/2017 (GMT)
- Who voted?
- 346
- 0
- Timeframe : Daily

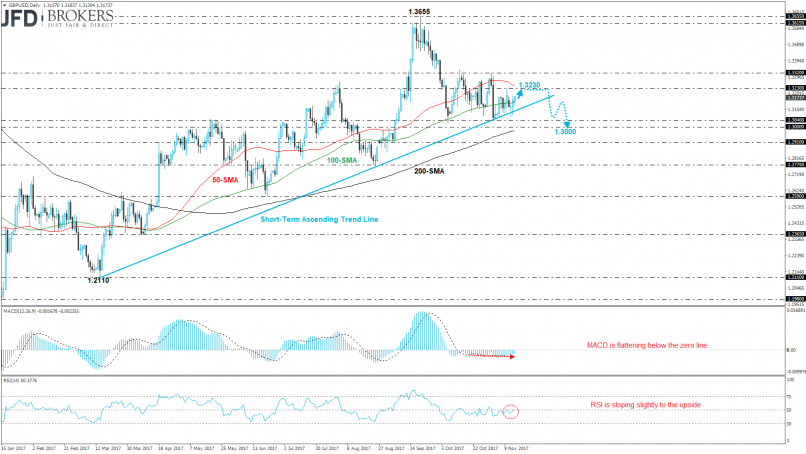
GBP/USD Chart
Are you looking for opportunities in indices and forex?
DISCOVER LONDINIA OPPORTUNITIES...
DISCOVER LONDINIA OPPORTUNITIES...
Sterling is still holding above the short-term ascending trend line versus the greenback and managed to challenge it several times over the last two weeks. The GBP/USD pair failed to break below the diagonal line and touch the 1.3000 strong psychological level, so far. Meanwhile, the price jumped above the 100-day SMA and is moving towards the 1.3230 resistance level, which coincides with the 50-day SMA. However, if the price prints a pullback on the latter level will open the way for 1.3000. On the other hand, a run above 1.3230 will expose the cable towards 1.3320. Technical indicators are moving with weak momentum near its mid-levels and they don’t give any clear signals for the tendency on price.
This member declared not having a position on this financial instrument or a related financial instrument.
About author

Offline


Add a comment
Comments
0 comments on the analysis GBP/USD - Daily