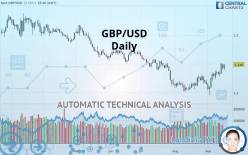
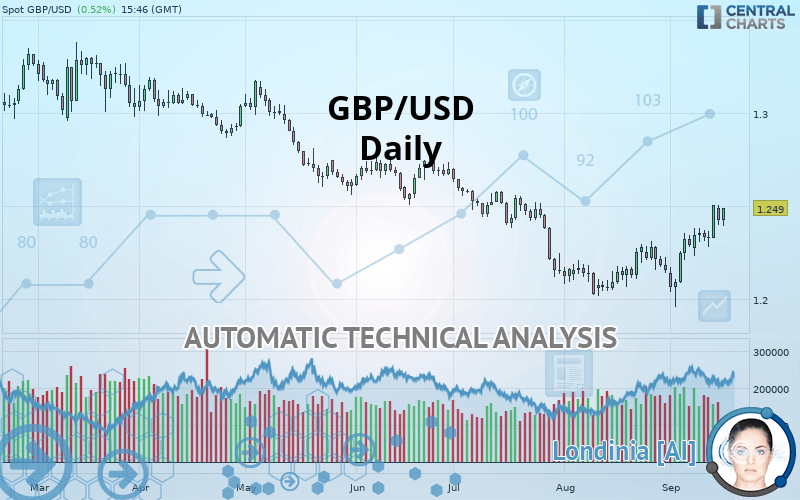
GBP/USD - Daily - Technical analysis published on 09/17/2019 (GMT)
- Who voted?
- 166
- 0
Click here for a new analysis!
- Timeframe : Daily
- - Analysis generated on
- Status : TARGET REACHED
Summary of the analysis

Additional analysis
Quotes
The GBP/USD rating is 1.2489 USD. On the day, this instrument gained +0.52% with the lowest point at 1.2392 USD and the highest point at 1.2492 USD. The deviation from the price is +0.78% for the low point and -0.02% for the high point.The Central Gaps scanner detects a bullish opening marking the presence of buyers ahead of sellers at the opening but not sufficiently marked to allow the price to register a quotation gap.
Bullish opening
Type : Bullish
Timeframe : Openning
So that you have an overall view of the price change, here is a table showing the variations over several periods:
Near a new LOW record (5 years)
Type : Bearish
Timeframe : Weekly
Near a new LOW record (1st january)
Type : Bearish
Timeframe : Weekly
Technical
A technical analysis in Daily of this GBP/USD chart shows a slightly bullish trend. Only 57.14% of the signals given by moving averages are bullish. This slightly bullish trend is reinforced by the strong signals currently being given by short-term moving averages. The Central Indicators market scanner currently does not detect any result that concerns moving averages.
In fact, according to the parameters integrated into the Central Analyzer system, 17 technical indicators out of 18 analysed are currently bullish. Caution: the Central Indicators scanner currently detects an excess:
CCI indicator is overbought : over 100
Type : Neutral
Timeframe : Daily
Previous candle closed over Bollinger bands
Type : Neutral
Timeframe : Daily
MACD indicator: bearish divergence
Type : Bearish
Timeframe : Daily
Williams %R indicator is overbought : over -20
Type : Neutral
Timeframe : Daily
Pivot points : price is over resistance 1
Type : Neutral
Timeframe : Daily
Ichimoku - Bullish crossover : Tenkan & Kijun
Type : Bullish
Timeframe : Daily
Price is back over the pivot point
Type : Bullish
Timeframe : Weekly
Price is back under the pivot point
Type : Bearish
Timeframe : Daily
The Central Patterns scanner, which studies chart patterns, resistances and supports, has identified these signals:
Near horizontal resistance
Type : Bearish
Timeframe : Daily
Resistance of channel is broken
Type : Bullish
Timeframe : Daily
The presence of a bearish pattern in Japanese candlesticks detected by Central Candlesticks that could cause a correction in the very short term was also detected:
Bearish harami
Type : Bearish
Timeframe : Daily
| S3 | S2 | S1 | Price | R1 | R2 | R3 | |
|---|---|---|---|---|---|---|---|
| ProTrendLines | 1.2039 | 1.2170 | 1.2283 | 1.2489 | 1.2493 | 1.2743 | 1.3032 |
| Change (%) | -3.60% | -2.55% | -1.65% | - | +0.03% | +2.03% | +4.35% |
| Change | -0.0450 | -0.0319 | -0.0206 | - | +0.0004 | +0.0254 | +0.0543 |
| Level | Major | Minor | Major | - | Major | Major | Minor |
To determine price objectives, it is also possible to use the pivot points. Here is the price position in relation to pivot points:
| Pivot points | S3 | S2 | S1 | PP | R1 | R2 | R3 |
|---|---|---|---|---|---|---|---|
| Standard | 1.2324 | 1.2362 | 1.2393 | 1.2431 | 1.2462 | 1.2500 | 1.2531 |
| Camarilla | 1.2406 | 1.2412 | 1.2419 | 1.2425 | 1.2431 | 1.2438 | 1.2444 |
| Woodie | 1.2322 | 1.2360 | 1.2391 | 1.2429 | 1.2460 | 1.2498 | 1.2529 |
| Fibonacci | 1.2362 | 1.2388 | 1.2404 | 1.2431 | 1.2457 | 1.2473 | 1.2500 |
| Pivot points | S3 | S2 | S1 | PP | R1 | R2 | R3 |
|---|---|---|---|---|---|---|---|
| Standard | 1.2050 | 1.2141 | 1.2323 | 1.2414 | 1.2596 | 1.2687 | 1.2869 |
| Camarilla | 1.2429 | 1.2454 | 1.2479 | 1.2504 | 1.2529 | 1.2554 | 1.2579 |
| Woodie | 1.2095 | 1.2164 | 1.2368 | 1.2437 | 1.2641 | 1.2710 | 1.2914 |
| Fibonacci | 1.2141 | 1.2246 | 1.2310 | 1.2414 | 1.2519 | 1.2583 | 1.2687 |
| Pivot points | S3 | S2 | S1 | PP | R1 | R2 | R3 |
|---|---|---|---|---|---|---|---|
| Standard | 1.1718 | 1.1866 | 1.2013 | 1.2161 | 1.2308 | 1.2456 | 1.2603 |
| Camarilla | 1.2078 | 1.2105 | 1.2132 | 1.2159 | 1.2186 | 1.2213 | 1.2240 |
| Woodie | 1.1717 | 1.1866 | 1.2012 | 1.2161 | 1.2307 | 1.2456 | 1.2602 |
| Fibonacci | 1.1866 | 1.1979 | 1.2049 | 1.2161 | 1.2274 | 1.2344 | 1.2456 |
Numerical data
The following are the details of the technical indicators and moving averages that were collected to generate this technical analysis:
| RSI (14): | 62.52 | |
| MACD (12,26,9): | 0.0053 | |
| Directional Movement: | 7.4934 | |
| AROON (14): | 57.1429 | |
| DEMA (21): | 1.2358 | |
| Parabolic SAR (0,02-0,02-0,2): | 1.2090 | |
| Elder Ray (13): | 0.0099 | |
| Super Trend (3,10): | 1.2117 | |
| Zig ZAG (10): | 1.2482 | |
| VORTEX (21): | 1.1083 | |
| Stochastique (14,3,5): | 93.37 | |
| TEMA (21): | 1.2445 | |
| Williams %R (14): | -4.20 | |
| Chande Momentum Oscillator (20): | 0.0324 | |
| Repulse (5,40,3): | 1.5418 | |
| ROCnROLL: | 1 | |
| TRIX (15,9): | 0.0239 | |
| Courbe Coppock: | 3.24 |
| MA7: | 1.2398 | |
| MA20: | 1.2276 | |
| MA50: | 1.2279 | |
| MA100: | 1.2508 | |
| MAexp7: | 1.2400 | |
| MAexp20: | 1.2309 | |
| MAexp50: | 1.2332 | |
| MAexp100: | 1.2472 | |
| Price / MA7: | +0.73% | |
| Price / MA20: | +1.74% | |
| Price / MA50: | +1.71% | |
| Price / MA100: | -0.15% | |
| Price / MAexp7: | +0.73% | |
| Price / MAexp20: | +1.47% | |
| Price / MAexp50: | +1.28% | |
| Price / MAexp100: | +0.14% |
News
The latest news and videos published on GBP/USD at the time of the analysis were as follows:
-
 GBP/USD Technical Analysis for September 17, 2019 by FXEmpire
-
GBP/USD Technical Analysis for September 16, 2019 by FXEmpire
-
GBP/USD Technical Analysis for September 13, 2019 by FXEmpire
-
GBP/USD Technical Analysis for September 12, 2019 by FXEmpire
-
GBP/USD Technical Analysis for September 11, 2019 by FXEmpire
About author

Online


Add a comment
Comments
0 comments on the analysis GBP/USD - Daily