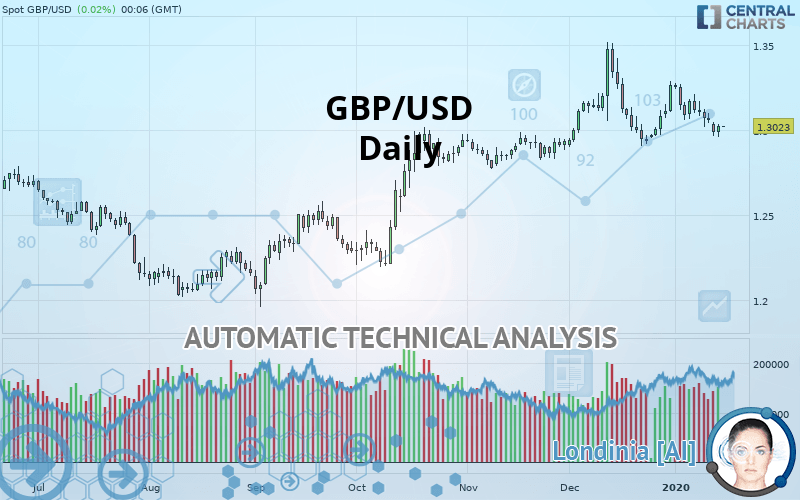
GBP/USD - Daily - Technical analysis published on 01/15/2020 (GMT)
- Who voted?
- 180
- 0
Click here for a new analysis!
- Timeframe : Daily
- - Analysis generated on
- Status : LEVEL MAINTAINED

Summary of the analysis

Additional analysis
Quotes
GBP/USD rating 1.3023 USD. On the day, this instrument gained +0.02% with the lowest point at 1.3021 USD and the highest point at 1.3024 USD. The deviation from the price is +0.02% for the low point and -0.01% for the high point.Here is a more detailed summary of the historical variations registered by GBP/USD:
Near a new HIGH record (1st january)
Type : Bullish
Timeframe : Weekly
Near a new HIGH record (1 month)
Type : Bullish
Timeframe : Weekly
Technical
Technical analysis of this Daily chart of GBP/USD indicates that the overall trend is bullish. 67.86% of the signals given by moving averages are bullish. Caution: the current slightly bearish signals from short-term moving averages indicate that the overall trend may be slowing down. An assessment of moving averages reveals several bearish signals that could impact this trend:
Bearish price crossover with Moving Average 50
Type : Bearish
Timeframe : Daily
Bearish price crossover with adaptative moving average 50
Type : Bearish
Timeframe : Daily
The probability of a further decline is low given the direction of the technical indicators.
But beware of excesses. The Central Indicators scanner currently detects this:
Williams %R indicator is oversold : under -80
Type : Neutral
Timeframe : Daily
Price is back over the pivot point
Type : Bullish
Timeframe : Daily
Price is back under the pivot point
Type : Bearish
Timeframe : Daily
Momentum indicator is back under 0
Type : Bearish
Timeframe : Daily
An analysis of the price chart with the Central Patterns scanner (detector of chart patterns and resistances and supports) shows several results that can have an impact on the price change:
Near horizontal support
Type : Bullish
Timeframe : Daily
Near support of triangle
Type : Bullish
Timeframe : Daily
Support of channel is broken
Type : Bearish
Timeframe : Daily
Central Candlesticks, the scanner specialised in Japanese candlesticks, detects a bullish signal that could support the hypothesis of a small rebound in the very short term:
Bullish harami
Type : Bullish
Timeframe : Daily
| S3 | S2 | S1 | Price | R1 | R2 | R3 | |
|---|---|---|---|---|---|---|---|
| ProTrendLines | 1.2212 | 1.2493 | 1.2743 | 1.3023 | 1.3044 | 1.3317 | 1.3473 |
| Change (%) | -6.23% | -4.07% | -2.15% | - | +0.16% | +2.26% | +3.46% |
| Change | -0.0811 | -0.0530 | -0.0280 | - | +0.0021 | +0.0294 | +0.0450 |
| Level | Minor | Intermediate | Intermediate | - | Major | Major | Minor |
Pivot points can also be used to set your price objectives. Here is the price situation in relation to pivot points:
| Pivot points | S3 | S2 | S1 | PP | R1 | R2 | R3 |
|---|---|---|---|---|---|---|---|
| Standard | 1.2893 | 1.2924 | 1.2972 | 1.3003 | 1.3051 | 1.3082 | 1.3130 |
| Camarilla | 1.2963 | 1.2971 | 1.2978 | 1.2986 | 1.2994 | 1.3001 | 1.3043 |
| Woodie | 1.2860 | 1.2911 | 1.2944 | 1.2995 | 1.3028 | 1.3079 | 1.3112 |
| Fibonacci | 1.2913 | 1.2945 | 1.2965 | 1.2997 | 1.3029 | 1.3049 | 1.3081 |
| Pivot points | S3 | S2 | S1 | PP | R1 | R2 | R3 |
|---|---|---|---|---|---|---|---|
| Standard | 1.2778 | 1.2895 | 1.2977 | 1.3094 | 1.3176 | 1.3293 | 1.3375 |
| Camarilla | 1.3003 | 1.3022 | 1.3040 | 1.3058 | 1.3076 | 1.3095 | 1.3113 |
| Woodie | 1.2760 | 1.2886 | 1.2959 | 1.3085 | 1.3158 | 1.3284 | 1.3357 |
| Fibonacci | 1.2895 | 1.2971 | 1.3018 | 1.3094 | 1.3170 | 1.3217 | 1.3293 |
| Pivot points | S3 | S2 | S1 | PP | R1 | R2 | R3 |
|---|---|---|---|---|---|---|---|
| Standard | 1.2314 | 1.2605 | 1.2933 | 1.3224 | 1.3552 | 1.3843 | 1.4171 |
| Camarilla | 1.3091 | 1.3148 | 1.3204 | 1.3261 | 1.3318 | 1.3375 | 1.3431 |
| Woodie | 1.2333 | 1.2614 | 1.2952 | 1.3233 | 1.3571 | 1.3852 | 1.4190 |
| Fibonacci | 1.2605 | 1.2842 | 1.2988 | 1.3224 | 1.3461 | 1.3607 | 1.3843 |
Numerical data
The following is the status of technical indicators and moving averages registered at the time this technical analysis was created:
| RSI (14): | 46.63 | |
| MACD (12,26,9): | -0.0001 | |
| Directional Movement: | -5.6806 | |
| AROON (14): | 28.5714 | |
| DEMA (21): | 1.3095 | |
| Parabolic SAR (0,02-0,02-0,2): | 1.3278 | |
| Elder Ray (13): | -0.0084 | |
| Super Trend (3,10): | 1.3300 | |
| Zig ZAG (10): | 1.3021 | |
| VORTEX (21): | 0.8556 | |
| Stochastique (14,3,5): | 23.09 | |
| TEMA (21): | 1.3052 | |
| Williams %R (14): | -79.39 | |
| Chande Momentum Oscillator (20): | -0.0061 | |
| Repulse (5,40,3): | -0.0386 | |
| ROCnROLL: | -1 | |
| TRIX (15,9): | 0.0237 | |
| Courbe Coppock: | 0.64 |
| MA7: | 1.3053 | |
| MA20: | 1.3068 | |
| MA50: | 1.3030 | |
| MA100: | 1.2779 | |
| MAexp7: | 1.3049 | |
| MAexp20: | 1.3074 | |
| MAexp50: | 1.3004 | |
| MAexp100: | 1.2875 | |
| Price / MA7: | -0.23% | |
| Price / MA20: | -0.34% | |
| Price / MA50: | -0.05% | |
| Price / MA100: | +1.91% | |
| Price / MAexp7: | -0.20% | |
| Price / MAexp20: | -0.39% | |
| Price / MAexp50: | +0.15% | |
| Price / MAexp100: | +1.15% |
News
Don"t forget to follow the news on GBP/USD. At the time of publication of this analysis, the latest news was as follows:
-
 GBP/USD Technical Analysis for January 15, 2020 by FXEmpire
-
GBP/USD Technical Analysis for January 14, 2020 by FXEmpire
-
Weekly Technical Analysis: 13/01/2020 - USDJPY, GBPUSD, NZDUSD
-
GBP/USD Technical Analysis for the week of January 13, 2020 by FXEmpire
-
GBP/USD Technical Analysis for January 13, 2020 by FXEmpire
About author

Online


Add a comment
Comments
0 comments on the analysis GBP/USD - Daily