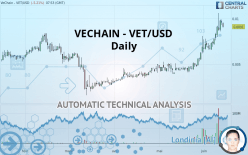
VECHAIN - VET/USD - Daily - Technical analysis published on 06/14/2020 (GMT)
- 293
- 0
Click here for a new analysis!
- Timeframe : Daily
- - Analysis generated on
- Status : TARGET REACHED

Summary of the analysis

Additional analysis
Quotes
The VECHAIN - VET/USD price is 0.009100 USD. The price is lower by -5.21% since the last closing and was traded between 0.009000 USD and 0.009600 USD over the period. The price is currently at +1.11% from its lowest and -5.21% from its highest.The Central Gaps scanner detects a bearish opening marking the presence of sellers ahead of buyers at the opening but not sufficiently marked to allow the price to register a quotation gap.
Bearish opening
Type : Bearish
Timeframe : Openning
So that you have an overall view of the price change, here is a table showing the variations over several periods:
Abnormal volumes
Timeframe : 5 days
Abnormal volumes
Timeframe : 20 days
Abnormal volumes
Timeframe : 50 days
Technical
A technical analysis in Daily of this VECHAIN - VET/USD chart shows a strongly bullish trend. 92.86% of the signals given by moving averages are bullish. The overall trend is supported by the strong bullish signals from short-term moving averages. There is no crossing of moving average by the price or crossing of moving averages between themselves.
In fact, 14 technical indicators on 18 studied are currently bullish. But beware of excesses. The Central Indicators scanner currently detects this:
RSI indicator is overbought : over 70
Type : Neutral
Timeframe : Daily
CCI indicator is overbought : over 100
Type : Neutral
Timeframe : Daily
RSI indicator: bearish divergence
Type : Bearish
Timeframe : Daily
Williams %R indicator is overbought : over -20
Type : Neutral
Timeframe : Daily
Pivot points : price is under support 1
Type : Neutral
Timeframe : Daily
Price is back over the pivot point
Type : Bullish
Timeframe : Weekly
The Central Patterns scanner, which studies chart patterns, resistances and supports, has identified this signal:
Resistance of channel is broken
Type : Bullish
Timeframe : Daily
The presence of a bearish pattern in Japanese candlesticks detected by Central Candlesticks that could cause a correction in the very short term was also detected:
Bearish harami
Type : Bearish
Timeframe : Daily
| S3 | S2 | S1 | Price | |
|---|---|---|---|---|
| ProTrendLines | 0.004961 | 0.006700 | 0.008202 | 0.009100 |
| Change (%) | -45.48% | -26.37% | -9.87% | - |
| Change | -0.004139 | -0.002400 | -0.000898 | - |
| Level | Intermediate | Major | Intermediate | - |
Attention could also be paid to pivot points to set price objectives:
| Pivot points | S3 | S2 | S1 | PP | R1 | R2 | R3 |
|---|---|---|---|---|---|---|---|
| Standard | 0.008700 | 0.009000 | 0.009300 | 0.009600 | 0.009900 | 0.010200 | 0.010500 |
| Camarilla | 0.009435 | 0.009490 | 0.009545 | 0.009600 | 0.009655 | 0.009710 | 0.009765 |
| Woodie | 0.008700 | 0.009000 | 0.009300 | 0.009600 | 0.009900 | 0.010200 | 0.010500 |
| Fibonacci | 0.009000 | 0.009229 | 0.009371 | 0.009600 | 0.009829 | 0.009971 | 0.010200 |
| Pivot points | S3 | S2 | S1 | PP | R1 | R2 | R3 |
|---|---|---|---|---|---|---|---|
| Standard | 0.003753 | 0.005327 | 0.007463 | 0.009037 | 0.011173 | 0.012747 | 0.014883 |
| Camarilla | 0.008580 | 0.008920 | 0.009260 | 0.009600 | 0.009940 | 0.010280 | 0.010620 |
| Woodie | 0.004035 | 0.005468 | 0.007745 | 0.009178 | 0.011455 | 0.012888 | 0.015165 |
| Fibonacci | 0.005327 | 0.006744 | 0.007619 | 0.009037 | 0.010454 | 0.011329 | 0.012747 |
| Pivot points | S3 | S2 | S1 | PP | R1 | R2 | R3 |
|---|---|---|---|---|---|---|---|
| Standard | 0.000342 | 0.002133 | 0.004517 | 0.006308 | 0.008692 | 0.010483 | 0.012867 |
| Camarilla | 0.005752 | 0.006135 | 0.006517 | 0.006900 | 0.007283 | 0.007665 | 0.008048 |
| Woodie | 0.000638 | 0.002281 | 0.004813 | 0.006456 | 0.008988 | 0.010631 | 0.013163 |
| Fibonacci | 0.002133 | 0.003728 | 0.004714 | 0.006308 | 0.007903 | 0.008889 | 0.010483 |
Numerical data
The following are the details of the technical indicators and moving averages that were collected to generate this technical analysis:
| RSI (14): | 70.07 | |
| MACD (12,26,9): | 0.0011 | |
| Directional Movement: | 28.803251 | |
| AROON (14): | 78.571426 | |
| DEMA (21): | 0.008985 | |
| Parabolic SAR (0,02-0,02-0,2): | 0.008600 | |
| Elder Ray (13): | 0.001118 | |
| Super Trend (3,10): | 0.006987 | |
| Zig ZAG (10): | 0.009100 | |
| VORTEX (21): | 1.2510 | |
| Stochastique (14,3,5): | 75.40 | |
| TEMA (21): | 0.009548 | |
| Williams %R (14): | -35.03 | |
| Chande Momentum Oscillator (20): | 0.001900 | |
| Repulse (5,40,3): | 0.1628 | |
| ROCnROLL: | 1 | |
| TRIX (15,9): | 2.4402 | |
| Courbe Coppock: | 96.15 |
| MA7: | 0.008929 | |
| MA20: | 0.007285 | |
| MA50: | 0.005650 | |
| MA100: | 0.004568 | |
| MAexp7: | 0.008878 | |
| MAexp20: | 0.007560 | |
| MAexp50: | 0.006150 | |
| MAexp100: | 0.005459 | |
| Price / MA7: | +1.92% | |
| Price / MA20: | +24.91% | |
| Price / MA50: | +61.06% | |
| Price / MA100: | +99.21% | |
| Price / MAexp7: | +2.50% | |
| Price / MAexp20: | +20.37% | |
| Price / MAexp50: | +47.97% | |
| Price / MAexp100: | +66.70% |
About author

Online


Add a comment
Comments
0 comments on the analysis VECHAIN - VET/USD - Daily