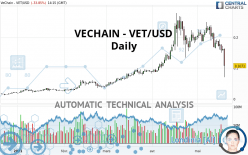
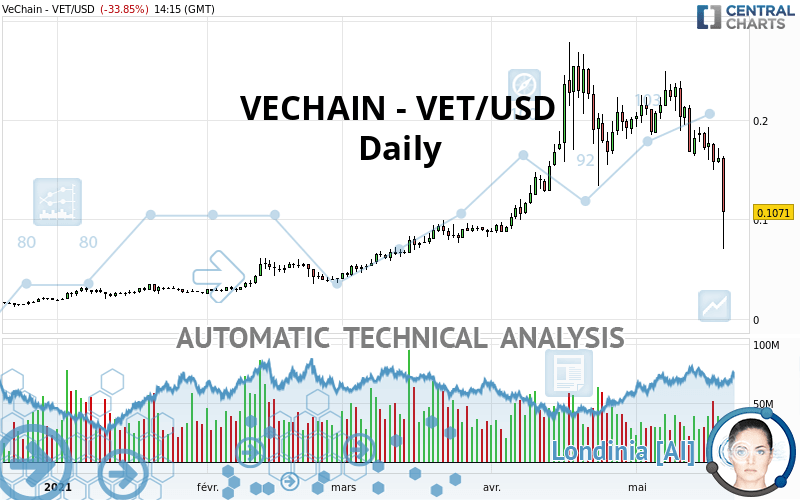
VECHAIN - VET/USD - Daily - Technical analysis published on 05/19/2021 (GMT)
- 236
- 0
Click here for a new analysis!
- Timeframe : Daily
- - Analysis generated on
- Status : TARGET REACHED
Summary of the analysis

Additional analysis
Quotes
The VECHAIN - VET/USD rating is 0.107100 USD. The price registered a decrease of -33.85% on the session with the lowest point at 0.070570 USD and the highest point at 0.164400 USD. The deviation from the price is +51.76% for the low point and -34.85% for the high point.The Central Gaps scanner detects a bullish opening marking the presence of buyers ahead of sellers at the opening but not sufficiently marked to allow the price to register a quotation gap.
Bullish opening
Type : Bullish
Timeframe : Openning
A study of price movements over other periods shows the following variations:
Technical
Technical analysis of this Daily chart of VECHAIN - VET/USD indicates that the overall trend is slightly bearish. 53.57% of the signals given by moving averages are bearish. The overall trend could accelerate as a result of the strong bearish signals from short-term moving averages. The Central Indicators scanner detects a bullish signal on moving averages that could impact this trend:
Bullish trend reversal : Moving Average 20
Type : Bullish
Timeframe : Daily
An assessment of technical indicators shows a strong bearish signal.
But beware of excesses. The Central Indicators scanner currently detects this:
CCI indicator is oversold : under -100
Type : Neutral
Timeframe : Daily
RSI indicator: bullish divergence
Type : Bullish
Timeframe : Daily
Williams %R indicator is oversold : under -80
Type : Neutral
Timeframe : Daily
Pivot points : price is under support 2
Type : Neutral
Timeframe : Weekly
Pivot points : price is under support 3
Type : Neutral
Timeframe : Daily
Price is back over the pivot point
Type : Bullish
Timeframe : Weekly
An analysis of the price chart with the Central Patterns scanner (detector of chart patterns and resistances and supports) shows several results that can have an impact on the price change:
Near support of triangle
Type : Bullish
Timeframe : Daily
Horizontal support is broken
Type : Bearish
Timeframe : Daily
Support of channel is broken
Type : Bearish
Timeframe : Daily
Central Candlesticks, the scanner specialised in Japanese candlesticks, detects a bullish signal that could support the hypothesis of a small rebound in the very short term:
Bullish harami
Type : Bullish
Timeframe : Daily
| S3 | S2 | S1 | Price | R1 | R2 | R3 | |
|---|---|---|---|---|---|---|---|
| ProTrendLines | 0.008934 | 0.054997 | 0.093240 | 0.107100 | 0.167900 | 0.188300 | 0.233900 |
| Change (%) | -91.66% | -48.65% | -12.94% | - | +56.77% | +75.82% | +118.39% |
| Change | -0.098166 | -0.052103 | -0.013860 | - | +0.060800 | +0.081200 | +0.126800 |
| Level | Major | Minor | Intermediate | - | Major | Intermediate | Minor |
Attention could also be paid to pivot points to set price objectives:
| Pivot points | S3 | S2 | S1 | PP | R1 | R2 | R3 |
|---|---|---|---|---|---|---|---|
| Standard | 0.139667 | 0.148033 | 0.154967 | 0.163333 | 0.170267 | 0.178633 | 0.185567 |
| Camarilla | 0.157693 | 0.159095 | 0.160498 | 0.161900 | 0.163303 | 0.164705 | 0.166108 |
| Woodie | 0.138950 | 0.147675 | 0.154250 | 0.162975 | 0.169550 | 0.178275 | 0.184850 |
| Fibonacci | 0.148033 | 0.153878 | 0.157489 | 0.163333 | 0.169178 | 0.172789 | 0.178633 |
| Pivot points | S3 | S2 | S1 | PP | R1 | R2 | R3 |
|---|---|---|---|---|---|---|---|
| Standard | 0.067700 | 0.115600 | 0.143800 | 0.191700 | 0.219900 | 0.267800 | 0.296000 |
| Camarilla | 0.151073 | 0.158048 | 0.165024 | 0.172000 | 0.178976 | 0.185952 | 0.192928 |
| Woodie | 0.057850 | 0.110675 | 0.133950 | 0.186775 | 0.210050 | 0.262875 | 0.286150 |
| Fibonacci | 0.115600 | 0.144670 | 0.162630 | 0.191700 | 0.220770 | 0.238730 | 0.267800 |
| Pivot points | S3 | S2 | S1 | PP | R1 | R2 | R3 |
|---|---|---|---|---|---|---|---|
| Standard | -0.093967 | -0.003833 | 0.098533 | 0.188667 | 0.291033 | 0.381167 | 0.483533 |
| Camarilla | 0.147963 | 0.165608 | 0.183254 | 0.200900 | 0.218546 | 0.236192 | 0.253838 |
| Woodie | -0.087850 | -0.000775 | 0.104650 | 0.191725 | 0.297150 | 0.384225 | 0.489650 |
| Fibonacci | -0.003833 | 0.069702 | 0.115132 | 0.188667 | 0.262202 | 0.307632 | 0.381167 |
Numerical data
The following is the status of technical indicators and moving averages registered at the time this technical analysis was created:
| RSI (14): | 33.81 | |
| MACD (12,26,9): | -0.0091 | |
| Directional Movement: | -27.804083 | |
| AROON (14): | -85.714286 | |
| DEMA (21): | 0.174547 | |
| Parabolic SAR (0,02-0,02-0,2): | 0.240466 | |
| Elder Ray (13): | -0.057037 | |
| Super Trend (3,10): | 0.218557 | |
| Zig ZAG (10): | 0.128200 | |
| VORTEX (21): | 0.8004 | |
| Stochastique (14,3,5): | 15.43 | |
| TEMA (21): | 0.153682 | |
| Williams %R (14): | -74.40 | |
| Chande Momentum Oscillator (20): | -0.114000 | |
| Repulse (5,40,3): | -48.2999 | |
| ROCnROLL: | 2 | |
| TRIX (15,9): | 0.1286 | |
| Courbe Coppock: | 45.31 |
| MA7: | 0.163371 | |
| MA20: | 0.194215 | |
| MA50: | 0.175156 | |
| MA100: | 0.118677 | |
| MAexp7: | 0.157491 | |
| MAexp20: | 0.182480 | |
| MAexp50: | 0.168308 | |
| MAexp100: | 0.132981 | |
| Price / MA7: | -34.44% | |
| Price / MA20: | -44.85% | |
| Price / MA50: | -38.85% | |
| Price / MA100: | -9.76% | |
| Price / MAexp7: | -32.00% | |
| Price / MAexp20: | -41.31% | |
| Price / MAexp50: | -36.37% | |
| Price / MAexp100: | -19.46% |
About author

Online


Add a comment
Comments
0 comments on the analysis VECHAIN - VET/USD - Daily