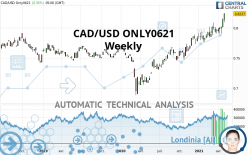
CAD/USD ONLY0621 - Weekly - Technical analysis published on 05/08/2021 (GMT)
- 155
- 0
- Timeframe : Weekly
- - Analysis generated on
- Status : CANCELLED

Summary of the analysis
Additional analysis
Quotes
CAD/USD ONLY0621 rating 0.82370 USD. Over 5 days, this instrument gained +1.14% with the lowest point at 0.80955 USD and the highest point at 0.82480 USD. The deviation from the price is +1.75% for the low point and -0.13% for the high point.A bullish opening was detected by the Central Gaps scanner. Buyers are trying to impose a bullish momentum in the very short term.
Bullish opening
Type : Bullish
Timeframe : Openning
So that you have an overall view of the price change, here is a table showing the variations over several periods:
New HIGH record (5 years)
Type : Bullish
Timeframe : Weekly
New HIGH record (1 year)
Type : Bullish
Timeframe : Weekly
New HIGH record (1st january)
Type : Bullish
Timeframe : Weekly
New HIGH record (1 month)
Type : Bullish
Timeframe : Weekly
Near a new LOW record (1 month)
Type : Bearish
Timeframe : Weekly
The Central Volumes scanner notes the presence of abnormal volumes:
Abnormal volumes
Timeframe : 5 days
Abnormal volumes
Timeframe : 20 days
Abnormal volumes
Timeframe : 50 days
Technical
Technical analysis of CAD/USD ONLY0621 in Weekly shows a strongly overall bullish trend. 92.86% of the signals given by moving averages are bullish. This strongly bullish trend is supported by the strong bullish signals given by short-term moving averages. The Central Indicators market scanner currently does not detect any result that concerns moving averages.
In fact, according to the parameters integrated into the Central Analyzer system, 17 technical indicators out of 18 analysed are currently bullish. But beware of excesses. The Central Indicators scanner currently detects this:
RSI indicator is overbought : over 70
Type : Neutral
Timeframe : Weekly
CCI indicator is overbought : over 100
Type : Neutral
Timeframe : Weekly
Williams %R indicator is overbought : over -20
Type : Neutral
Timeframe : Weekly
Pivot points : price is over resistance 1
Type : Neutral
Timeframe : Weekly
MACD crosses UP its Moving Average
Type : Bullish
Timeframe : Weekly
Parabolic SAR indicator bullish reversal
Type : Bullish
Timeframe : Weekly
Central Patterns, the scanner specializing in chart patterns, did not identify any signals.
For a small rebound in the very short term, the Central Candlesticks scanner currently notes the presence of this bullish pattern in Japanese candlesticks:
Three white soldiers
Type : Bullish
Timeframe : Weekly
| S3 | S2 | S1 | Price | |
|---|---|---|---|---|
| ProTrendLines | 0.77023 | 0.80567 | 0.82265 | 0.82370 |
| Change (%) | -6.49% | -2.19% | -0.13% | - |
| Change | -0.05347 | -0.01803 | -0.00105 | - |
| Level | Intermediate | Intermediate | Major | - |
Pivot points can also be used to set your price objectives. Here is the price situation in relation to pivot points:
| Pivot points | S3 | S2 | S1 | PP | R1 | R2 | R3 |
|---|---|---|---|---|---|---|---|
| Standard | 0.80528 | 0.80952 | 0.81518 | 0.81942 | 0.82508 | 0.82932 | 0.83498 |
| Camarilla | 0.81813 | 0.81904 | 0.81994 | 0.82085 | 0.82176 | 0.82267 | 0.82357 |
| Woodie | 0.80600 | 0.80988 | 0.81590 | 0.81978 | 0.82580 | 0.82968 | 0.83570 |
| Fibonacci | 0.80952 | 0.81330 | 0.81564 | 0.81942 | 0.82320 | 0.82554 | 0.82932 |
| Pivot points | S3 | S2 | S1 | PP | R1 | R2 | R3 |
|---|---|---|---|---|---|---|---|
| Standard | 0.79037 | 0.79553 | 0.80497 | 0.81013 | 0.81957 | 0.82473 | 0.83417 |
| Camarilla | 0.81039 | 0.81172 | 0.81306 | 0.81440 | 0.81574 | 0.81708 | 0.81842 |
| Woodie | 0.79250 | 0.79660 | 0.80710 | 0.81120 | 0.82170 | 0.82580 | 0.83630 |
| Fibonacci | 0.79553 | 0.80111 | 0.80456 | 0.81013 | 0.81571 | 0.81916 | 0.82473 |
| Pivot points | S3 | S2 | S1 | PP | R1 | R2 | R3 |
|---|---|---|---|---|---|---|---|
| Standard | 0.77312 | 0.78173 | 0.79807 | 0.80668 | 0.82302 | 0.83163 | 0.84797 |
| Camarilla | 0.80754 | 0.80983 | 0.81211 | 0.81440 | 0.81669 | 0.81897 | 0.82126 |
| Woodie | 0.77698 | 0.78366 | 0.80193 | 0.80861 | 0.82688 | 0.83356 | 0.85183 |
| Fibonacci | 0.78173 | 0.79126 | 0.79715 | 0.80668 | 0.81621 | 0.82210 | 0.83163 |
Numerical data
The following is the status of technical indicators and moving averages registered at the time this technical analysis was created:
| RSI (14): | 76.75 | |
| MACD (12,26,9): | 0.0118 | |
| Directional Movement: | 27.42073 | |
| AROON (14): | 100.00000 | |
| DEMA (21): | 0.80978 | |
| Parabolic SAR (0,02-0,02-0,2): | 0.79035 | |
| Elder Ray (13): | 0.01649 | |
| Super Trend (3,10): | 0.78348 | |
| Zig ZAG (10): | 0.82455 | |
| VORTEX (21): | 1.1364 | |
| Stochastique (14,3,5): | 91.71 | |
| TEMA (21): | 0.81300 | |
| Williams %R (14): | -0.53 | |
| Chande Momentum Oscillator (20): | 0.03740 | |
| Repulse (5,40,3): | 4.3032 | |
| ROCnROLL: | 1 | |
| TRIX (15,9): | 0.1944 | |
| Courbe Coppock: | 5.38 |
| MA7: | 0.81655 | |
| MA20: | 0.80618 | |
| MA50: | 0.79991 | |
| MA100: | 0.79292 | |
| MAexp7: | 0.80754 | |
| MAexp20: | 0.79450 | |
| MAexp50: | 0.77705 | |
| MAexp100: | 0.76818 | |
| Price / MA7: | +0.88% | |
| Price / MA20: | +2.17% | |
| Price / MA50: | +2.97% | |
| Price / MA100: | +3.88% | |
| Price / MAexp7: | +2.00% | |
| Price / MAexp20: | +3.68% | |
| Price / MAexp50: | +6.00% | |
| Price / MAexp100: | +7.23% |
About author

Online


Add a comment
Comments
0 comments on the analysis CAD/USD ONLY0621 - Weekly