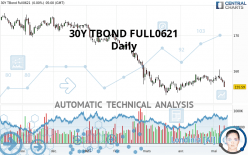
30Y TBOND FULL0624 - Daily - Technical analysis published on 05/13/2021 (GMT)
- 168
- 0
Click here for a new analysis!
- Timeframe : Daily
- - Analysis generated on
- Status : LEVEL MAINTAINED

Summary of the analysis

Additional analysis
Quotes
The 30Y TBOND FULL0621 price is 155.91 USD. On the day, this instrument gained +0.21% with the lowest point at 155.50 USD and the highest point at 156.00 USD. The deviation from the price is +0.26% for the low point and -0.06% for the high point.The Central Gaps scanner detects a bearish opening. A small advantage for sellers in the very short term.
Bearish opening
Type : Bearish
Timeframe : Openning
A study of price movements over other periods shows the following variations:
Near a new LOW record (1st january)
Type : Bearish
Timeframe : Weekly
Near a new HIGH record (1 month)
Type : Bullish
Timeframe : Weekly
Technical
Technical analysis of this Daily chart of 30Y TBOND FULL0621 indicates that the overall trend is strongly bearish. 89.29% of the signals given by moving averages are bearish. The overall trend is supported by the strong bearish signals from short-term moving averages. The Central Indicators scanner detects a bearish signal on moving averages that could impact this trend:
Bearish price crossover with Moving Average 50
Type : Bearish
Timeframe : Daily
Technical indicators are bearish. There is still some doubt about the decline in the price.
Caution: the Central Indicators scanner currently detects an excess:
CCI indicator is oversold : under -100
Type : Neutral
Timeframe : Daily
Williams %R indicator is oversold : under -80
Type : Neutral
Timeframe : Daily
Pivot points : price is under support 1
Type : Neutral
Timeframe : Weekly
Parabolic SAR indicator bearish reversal
Type : Bearish
Timeframe : Daily
Ichimoku : price is under the cloud
Type : Bearish
Timeframe : Daily
MACD indicator is back under 0
Type : Bearish
Timeframe : Daily
Price is back under the pivot point
Type : Bearish
Timeframe : Daily
No signals are given by Central Patterns, a market scanner specialised in chart patterns, resistances and supports.
The Central Candlesticks scanner, specialised in Japanese candlesticks, did not identify any signals.
| S3 | S2 | S1 | Price | R1 | R2 | R3 | |
|---|---|---|---|---|---|---|---|
| ProTrendLines | 136.69 | 146.01 | 152.80 | 155.91 | 158.59 | 160.59 | 165.81 |
| Change (%) | -12.33% | -6.35% | -1.99% | - | +1.72% | +3.00% | +6.35% |
| Change | -19.22 | -9.90 | -3.11 | - | +2.68 | +4.68 | +9.90 |
| Level | Major | Minor | Major | - | Major | Intermediate | Intermediate |
Attention could also be paid to pivot points to set price objectives:
| Pivot points | S3 | S2 | S1 | PP | R1 | R2 | R3 |
|---|---|---|---|---|---|---|---|
| Standard | 153.25 | 154.38 | 155.03 | 156.16 | 156.81 | 157.94 | 158.59 |
| Camarilla | 155.20 | 155.36 | 155.53 | 155.69 | 155.85 | 156.02 | 156.18 |
| Woodie | 153.02 | 154.26 | 154.80 | 156.04 | 156.58 | 157.82 | 158.36 |
| Fibonacci | 154.38 | 155.06 | 155.48 | 156.16 | 156.84 | 157.26 | 157.94 |
| Pivot points | S3 | S2 | S1 | PP | R1 | R2 | R3 |
|---|---|---|---|---|---|---|---|
| Standard | 152.45 | 154.56 | 156.26 | 158.37 | 160.07 | 162.18 | 163.88 |
| Camarilla | 156.92 | 157.27 | 157.62 | 157.97 | 158.32 | 158.67 | 159.02 |
| Woodie | 152.26 | 154.46 | 156.07 | 158.27 | 159.88 | 162.08 | 163.69 |
| Fibonacci | 154.56 | 156.01 | 156.91 | 158.37 | 159.82 | 160.72 | 162.18 |
| Pivot points | S3 | S2 | S1 | PP | R1 | R2 | R3 |
|---|---|---|---|---|---|---|---|
| Standard | 151.44 | 153.32 | 155.28 | 157.16 | 159.12 | 161.00 | 162.96 |
| Camarilla | 156.19 | 156.55 | 156.90 | 157.25 | 157.60 | 157.95 | 158.31 |
| Woodie | 151.49 | 153.34 | 155.33 | 157.18 | 159.17 | 161.02 | 163.01 |
| Fibonacci | 153.32 | 154.78 | 155.69 | 157.16 | 158.62 | 159.53 | 161.00 |
Numerical data
The following are the details of the technical indicators and moving averages that were collected to generate this technical analysis:
| RSI (14): | 39.07 | |
| MACD (12,26,9): | -0.2100 | |
| Directional Movement: | -2.42 | |
| AROON (14): | -28.57 | |
| DEMA (21): | 157.09 | |
| Parabolic SAR (0,02-0,02-0,2): | 160.37 | |
| Elder Ray (13): | -1.43 | |
| Super Trend (3,10): | 159.27 | |
| Zig ZAG (10): | 155.91 | |
| VORTEX (21): | 0.9400 | |
| Stochastique (14,3,5): | 10.03 | |
| TEMA (21): | 157.23 | |
| Williams %R (14): | -90.57 | |
| Chande Momentum Oscillator (20): | -1.47 | |
| Repulse (5,40,3): | -0.9500 | |
| ROCnROLL: | 2 | |
| TRIX (15,9): | 0.0100 | |
| Courbe Coppock: | 1.19 |
| MA7: | 157.27 | |
| MA20: | 157.64 | |
| MA50: | 156.79 | |
| MA100: | 161.99 | |
| MAexp7: | 156.87 | |
| MAexp20: | 157.28 | |
| MAexp50: | 158.30 | |
| MAexp100: | 161.46 | |
| Price / MA7: | -0.86% | |
| Price / MA20: | -1.10% | |
| Price / MA50: | -0.56% | |
| Price / MA100: | -3.75% | |
| Price / MAexp7: | -0.61% | |
| Price / MAexp20: | -0.87% | |
| Price / MAexp50: | -1.51% | |
| Price / MAexp100: | -3.44% |
About author

Online


Add a comment
Comments
0 comments on the analysis 30Y TBOND FULL0624 - Daily