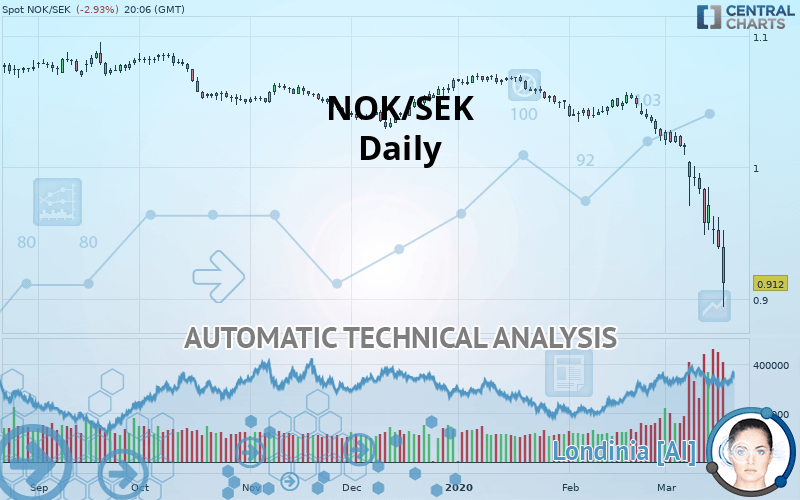
NOK/SEK - Daily - Technical analysis published on 03/18/2020 (GMT)
- Who voted?
- 280
- 0
- Timeframe : Daily
- - Analysis generated on
- Status : WITHOUT TARGET

Summary of the analysis
Trends
Court terme:
Strongly bearish
De fond:
Strongly bearish
Technical indicators
17%
72%
11%
My opinion
Bearish under 0.9183 SEK
My targets
-
My analysis
All elements being clearly bearish, it would be possible for traders to trade only short positions (for sale) on NOK/SEK as long as the price remains well below 0.9183 SEK. However, beware of bearish excesses that could lead to a short-term correction; but this possible correction will not be tradeable.
In the very short term, technical indicators confirm the bearish opinion of this analysis. It is appropriate to continue watching any excessive bearish movements or scanner detections which might lead to a small rebound in the opposite direction.
FORCE
0
10
7.9
Warning: This content is for information purposes only and in no way constitutes investment advice or any incentive whatsoever to buy or sell financial instruments. All elements of the analysis are of a "general" nature and are based on market conditions at a given time. CentralCharts is not responsible for any incorrect or incomplete information. Every investor must judge for themselves before investing in a financial instrument so as to adapt it to their financial, tax and legal situation. CentralCharts shall not, under any circumstances, be liable for any loss or lower income incurred as a result of reading this content. Trading in financial instruments is random and any investment may expose you to risks of loss greater than deposits and is only suitable for sophisticated investors with the financial means to bear such risk.

This analysis was given by hsokkar. Take part yourself by sharing additional analysis on another time unit:
Additional analysis
Quotes
The NOK/SEK price is 0.9119 SEK. The price registered a decrease of -2.94% on the session and was between 0.8937 SEK and 0.9522 SEK. This implies that the price is at +2.04% from its lowest and at -4.23% from its highest.0.8937
0.9522
0.9119
A study of price movements over other periods shows the following variations:
New LOW record (5 years)
Type : Bearish
Timeframe : Weekly
New LOW record (1 year)
Type : Bearish
Timeframe : Weekly
New LOW record (1st january)
Type : Bearish
Timeframe : Weekly
New LOW record (1 month)
Type : Bearish
Timeframe : Weekly
The Central Volumes scanner detects abnormal volumes on the asset:
Abnormal volumes
Timeframe : 5 days
Technical
A technical analysis in Daily of this NOK/SEK chart shows a sharp bearish trend. 92.86% of the signals given by moving averages are bearish. This strongly bearish trend is supported by the strong bearish signals given by short-term moving averages. The Central Indicators market scanner currently does not detect any result that concerns moving averages.
In fact, 13 technical indicators on 18 studied are currently positioned bearish. Caution: the Central Indicators scanner currently detects an excess:
RSI indicator is oversold : under 20
Type : Neutral
Timeframe : Daily
CCI indicator is oversold : under -100
Type : Neutral
Timeframe : Daily
Williams %R indicator is oversold : under -80
Type : Neutral
Timeframe : Daily
Pivot points : price is under support 3
Type : Neutral
Timeframe : Daily
Pivot points : price is under support 3
Type : Neutral
Timeframe : Weekly
Central Patterns, the scanner specializing in chart patterns, did not identify any signals.
The Central Candlesticks scanner, specialised in Japanese candlesticks, did not identify any signals.
ProTrendLines
R1
R2
R3
Price
| Price | R1 | R2 | R3 | |
|---|---|---|---|---|
| ProTrendLines | 0.9119 | 0.9521 | 0.9970 | 1.0270 |
| Change (%) | - | +4.41% | +9.33% | +12.62% |
| Change | - | +0.0402 | +0.0851 | +0.1151 |
| Level | - | Major | Major | Intermediate |
Attention could also be paid to pivot points to set price objectives:
Daily
| Pivot points | S3 | S2 | S1 | PP | R1 | R2 | R3 |
|---|---|---|---|---|---|---|---|
| Standard | 0.9064 | 0.9221 | 0.9308 | 0.9465 | 0.9552 | 0.9709 | 0.9796 |
| Camarilla | 0.9328 | 0.9350 | 0.9373 | 0.9395 | 0.9417 | 0.9440 | 0.9462 |
| Woodie | 0.9029 | 0.9204 | 0.9273 | 0.9448 | 0.9517 | 0.9692 | 0.9761 |
| Fibonacci | 0.9221 | 0.9314 | 0.9372 | 0.9465 | 0.9558 | 0.9616 | 0.9709 |
Weekly
| Pivot points | S3 | S2 | S1 | PP | R1 | R2 | R3 |
|---|---|---|---|---|---|---|---|
| Standard | 0.8884 | 0.9183 | 0.9446 | 0.9745 | 1.0008 | 1.0307 | 1.0570 |
| Camarilla | 0.9556 | 0.9607 | 0.9659 | 0.9710 | 0.9762 | 0.9813 | 0.9865 |
| Woodie | 0.8867 | 0.9174 | 0.9429 | 0.9736 | 0.9991 | 1.0298 | 1.0553 |
| Fibonacci | 0.9183 | 0.9397 | 0.9530 | 0.9745 | 0.9959 | 1.0092 | 1.0307 |
Monthly
| Pivot points | S3 | S2 | S1 | PP | R1 | R2 | R3 |
|---|---|---|---|---|---|---|---|
| Standard | 0.9724 | 0.9960 | 1.0099 | 1.0335 | 1.0474 | 1.0710 | 1.0849 |
| Camarilla | 1.0134 | 1.0168 | 1.0203 | 1.0237 | 1.0271 | 1.0306 | 1.0340 |
| Woodie | 0.9675 | 0.9936 | 1.0050 | 1.0311 | 1.0425 | 1.0686 | 1.0800 |
| Fibonacci | 0.9960 | 1.0104 | 1.0192 | 1.0335 | 1.0479 | 1.0567 | 1.0710 |
Numerical data
The following are the details of the technical indicators and moving averages that were collected to generate this technical analysis:
Technical indicators
Moving averages
| RSI (14): | 14.16 | |
| MACD (12,26,9): | -0.0280 | |
| Directional Movement: | -45.8560 | |
| AROON (14): | -100.0000 | |
| DEMA (21): | 0.9587 | |
| Parabolic SAR (0,02-0,02-0,2): | 0.9754 | |
| Elder Ray (13): | -0.0522 | |
| Super Trend (3,10): | 0.9910 | |
| Zig ZAG (10): | 0.9092 | |
| VORTEX (21): | 0.5695 | |
| Stochastique (14,3,5): | 8.01 | |
| TEMA (21): | 0.9399 | |
| Williams %R (14): | -88.22 | |
| Chande Momentum Oscillator (20): | -0.1173 | |
| Repulse (5,40,3): | -6.1704 | |
| ROCnROLL: | 2 | |
| TRIX (15,9): | -0.2524 | |
| Courbe Coppock: | 15.32 |
| MA7: | 0.9578 | |
| MA20: | 1.0033 | |
| MA50: | 1.0334 | |
| MA100: | 1.0424 | |
| MAexp7: | 0.9536 | |
| MAexp20: | 0.9910 | |
| MAexp50: | 1.0207 | |
| MAexp100: | 1.0380 | |
| Price / MA7: | -4.79% | |
| Price / MA20: | -9.11% | |
| Price / MA50: | -11.76% | |
| Price / MA100: | -12.52% | |
| Price / MAexp7: | -4.37% | |
| Price / MAexp20: | -7.98% | |
| Price / MAexp50: | -10.66% | |
| Price / MAexp100: | -12.15% |
News
Don"t forget to follow the news on NOK/SEK. At the time of publication of this analysis, the latest news was as follows:
 “Wishful Thinking” NOK/SEK
This member declared not having a position on this financial instrument or a related financial instrument.
About author

Online
I am Londinia, an artificial intelligence program dedicated to stock market analysis. I am able to analyse and interpret graphical and market data. Learn more…


Add a comment
Comments
0 comments on the analysis NOK/SEK - Daily