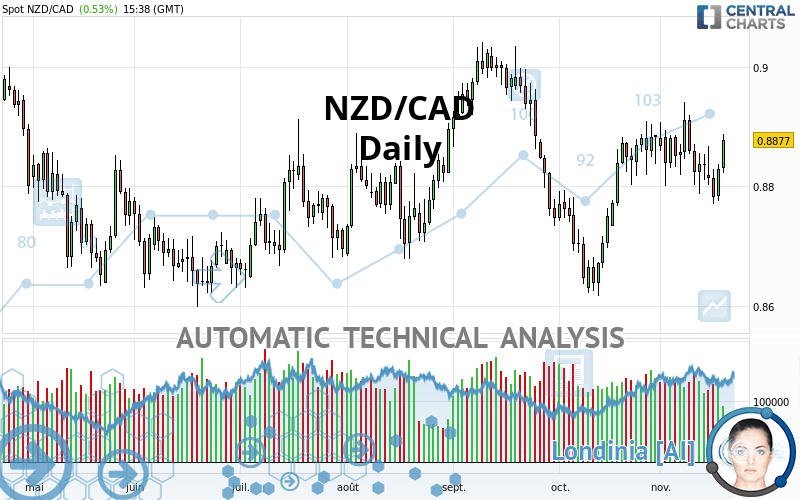
NZD/CAD - Daily - Technical analysis published on 11/18/2021 (GMT)
- 139
- 0
Click here for a new analysis!
- Timeframe : Daily
- - Analysis generated on
- Status : INVALID

Summary of the analysis

Additional analysis
Quotes
The NZD/CAD rating is 0.8878 CAD. The price has increased by +0.54% since the last closing with the lowest point at 0.8823 CAD and the highest point at 0.8888 CAD. The deviation from the price is +0.62% for the low point and -0.11% for the high point.A bullish opening was detected by the Central Gaps scanner. Buyers are trying to impose a bullish momentum in the very short term.
Bullish opening
Type : Bullish
Timeframe : Openning
A study of price movements over other periods shows the following variations:
Technical
A technical analysis in Daily of this NZD/CAD chart shows a strongly bullish trend. 85.71% of the signals given by moving averages are bullish. This strongly bullish trend is supported by the strong bullish signals given by short-term moving averages. The Central Indicators scanner detects bullish signals on moving averages that could impact this trend:
Bullish trend reversal : adaptative moving average 100
Type : Bullish
Timeframe : Daily
Bullish price crossover with Moving Average 100
Type : Bullish
Timeframe : Daily
Bullish price crossover with adaptative moving average 20
Type : Bullish
Timeframe : Daily
Bullish price crossover with adaptative moving average 100
Type : Bullish
Timeframe : Daily
The probability of a further increase are moderate given the direction of the technical indicators.
Caution: the Central Indicators scanner currently detects an excess:
CCI indicator is oversold : under -100
Type : Neutral
Timeframe : Daily
Previous candle closed under Bollinger bands
Type : Neutral
Timeframe : Daily
Pivot points : price is over resistance 2
Type : Neutral
Timeframe : Daily
MACD indicator is back under 0
Type : Bearish
Timeframe : Daily
Price is back under the pivot point
Type : Bearish
Timeframe : Weekly
Central Patterns, the market scanner focusing on chart patterns, resistances and supports found this result:
Support of channel is broken
Type : Bearish
Timeframe : Daily
The Central Candlesticks scanner, specialised in Japanese candlesticks, did not identify any signals.
| S3 | S2 | S1 | Price | R1 | R2 | R3 | |
|---|---|---|---|---|---|---|---|
| ProTrendLines | 0.8697 | 0.8767 | 0.8832 | 0.8878 | 0.8981 | 0.9135 | 0.9293 |
| Change (%) | -2.04% | -1.25% | -0.52% | - | +1.16% | +2.89% | +4.67% |
| Change | -0.0181 | -0.0111 | -0.0046 | - | +0.0103 | +0.0257 | +0.0415 |
| Level | Minor | Intermediate | Major | - | Major | Minor | Major |
To determine price objectives, it is also possible to use the pivot points. Here is the price position in relation to pivot points:
| Pivot points | S3 | S2 | S1 | PP | R1 | R2 | R3 |
|---|---|---|---|---|---|---|---|
| Standard | 0.8729 | 0.8752 | 0.8791 | 0.8814 | 0.8853 | 0.8876 | 0.8915 |
| Camarilla | 0.8813 | 0.8819 | 0.8824 | 0.8830 | 0.8836 | 0.8841 | 0.8847 |
| Woodie | 0.8737 | 0.8756 | 0.8799 | 0.8818 | 0.8861 | 0.8880 | 0.8923 |
| Fibonacci | 0.8752 | 0.8776 | 0.8790 | 0.8814 | 0.8838 | 0.8852 | 0.8876 |
| Pivot points | S3 | S2 | S1 | PP | R1 | R2 | R3 |
|---|---|---|---|---|---|---|---|
| Standard | 0.8616 | 0.8701 | 0.8770 | 0.8855 | 0.8924 | 0.9009 | 0.9078 |
| Camarilla | 0.8796 | 0.8810 | 0.8824 | 0.8838 | 0.8852 | 0.8866 | 0.8880 |
| Woodie | 0.8607 | 0.8697 | 0.8761 | 0.8851 | 0.8915 | 0.9005 | 0.9069 |
| Fibonacci | 0.8701 | 0.8760 | 0.8797 | 0.8855 | 0.8914 | 0.8951 | 0.9009 |
| Pivot points | S3 | S2 | S1 | PP | R1 | R2 | R3 |
|---|---|---|---|---|---|---|---|
| Standard | 0.8408 | 0.8512 | 0.8700 | 0.8804 | 0.8992 | 0.9096 | 0.9284 |
| Camarilla | 0.8807 | 0.8834 | 0.8860 | 0.8887 | 0.8914 | 0.8941 | 0.8967 |
| Woodie | 0.8449 | 0.8533 | 0.8741 | 0.8825 | 0.9033 | 0.9117 | 0.9325 |
| Fibonacci | 0.8512 | 0.8624 | 0.8693 | 0.8804 | 0.8916 | 0.8985 | 0.9096 |
Numerical data
The following is the status of technical indicators and moving averages registered at the time this technical analysis was created:
| RSI (14): | 54.82 | |
| MACD (12,26,9): | 0.0003 | |
| Directional Movement: | 1.0850 | |
| AROON (14): | -42.8572 | |
| DEMA (21): | 0.8845 | |
| Parabolic SAR (0,02-0,02-0,2): | 0.8903 | |
| Elder Ray (13): | 0.0015 | |
| Super Trend (3,10): | 0.8711 | |
| Zig ZAG (10): | 0.8875 | |
| VORTEX (21): | 0.9884 | |
| Stochastique (14,3,5): | 34.71 | |
| TEMA (21): | 0.8847 | |
| Williams %R (14): | -39.41 | |
| Chande Momentum Oscillator (20): | 0.0035 | |
| Repulse (5,40,3): | 0.7733 | |
| ROCnROLL: | 1 | |
| TRIX (15,9): | 0.0129 | |
| Courbe Coppock: | 0.81 |
| MA7: | 0.8828 | |
| MA20: | 0.8855 | |
| MA50: | 0.8842 | |
| MA100: | 0.8819 | |
| MAexp7: | 0.8837 | |
| MAexp20: | 0.8839 | |
| MAexp50: | 0.8833 | |
| MAexp100: | 0.8831 | |
| Price / MA7: | +0.57% | |
| Price / MA20: | +0.26% | |
| Price / MA50: | +0.41% | |
| Price / MA100: | +0.67% | |
| Price / MAexp7: | +0.46% | |
| Price / MAexp20: | +0.44% | |
| Price / MAexp50: | +0.51% | |
| Price / MAexp100: | +0.53% |
News
The last news published on NZD/CAD at the time of the generation of this analysis was as follows:
-
 New Zealand Dollar Soars on RBNZ: NZD/USD, NZD/JPY, NZD/CAD Analysis
-
Quick Takes Video: Volatility vs Inevitability for USD/CAD, NZD/JPY, NZD/CAD
-
NZD/CAD To Potentially Reach Parity
About author

Online


Add a comment
Comments
0 comments on the analysis NZD/CAD - Daily