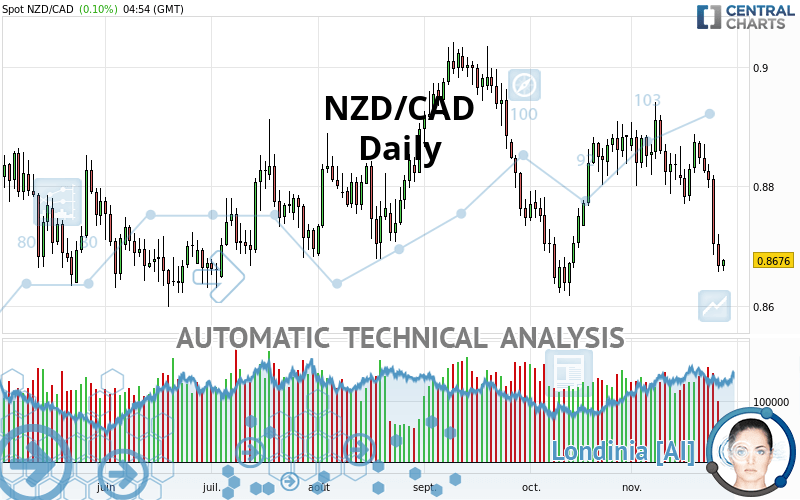
NZD/CAD - Daily - Technical analysis published on 11/26/2021 (GMT)
- 195
- 0
Click here for a new analysis!
- Timeframe : Daily
- - Analysis generated on
- Status : TARGET REACHED

Summary of the analysis

Additional analysis
Quotes
The NZD/CAD price is 0.8677 CAD. On the day, this instrument gained +0.12% and was between 0.8659 CAD and 0.8679 CAD. This implies that the price is at +0.21% from its lowest and at -0.02% from its highest.Here is a more detailed summary of the historical variations registered by NZD/CAD:
Near a new LOW record (1st january)
Type : Bearish
Timeframe : Weekly
Technical
Technical analysis of this Daily chart of NZD/CAD indicates that the overall trend is strongly bearish. 89.29% of the signals given by moving averages are bearish. The overall trend is supported by the strong bearish signals from short-term moving averages. The Central Indicators scanner detects a bearish signal on moving averages that could impact this trend:
Moving Average bearish crossovers : MA50 & MA100
Type : Bearish
Timeframe : Daily
The technical indicators are generally neutral. They do not provide relevant information on the direction of future price movements.
But beware of excesses. The Central Indicators scanner currently detects this:
CCI indicator is oversold : under -100
Type : Neutral
Timeframe : Daily
Previous candle closed under Bollinger bands
Type : Neutral
Timeframe : Daily
Williams %R indicator is oversold : under -80
Type : Neutral
Timeframe : Daily
Pivot points : price is under support 3
Type : Neutral
Timeframe : Weekly
Price is back over the pivot point
Type : Bullish
Timeframe : Weekly
Price is back under the pivot point
Type : Bearish
Timeframe : Daily
Central Patterns, the market scanner focusing on chart patterns, resistances and supports found these results:
Horizontal support is broken
Type : Bearish
Timeframe : Daily
Support of channel is broken
Type : Bearish
Timeframe : Daily
Support of triangle is broken
Type : Bearish
Timeframe : Daily
For a small setback in the very short term, the Central Candlesticks scanner currently notes the presence of this bearish pattern in Japanese candlesticks:
Three black crows
Type : Bearish
Timeframe : Daily
| S3 | S2 | S1 | Price | R1 | R2 | R3 | |
|---|---|---|---|---|---|---|---|
| ProTrendLines | 0.8180 | 0.8409 | 0.8637 | 0.8677 | 0.8697 | 0.8832 | 0.8911 |
| Change (%) | -5.73% | -3.09% | -0.46% | - | +0.23% | +1.79% | +2.70% |
| Change | -0.0497 | -0.0268 | -0.0040 | - | +0.0020 | +0.0155 | +0.0234 |
| Level | Minor | Major | Major | - | Intermediate | Intermediate | Minor |
To determine price objectives, it is also possible to use the pivot points. Here is the price position in relation to pivot points:
| Pivot points | S3 | S2 | S1 | PP | R1 | R2 | R3 |
|---|---|---|---|---|---|---|---|
| Standard | 0.8577 | 0.8616 | 0.8642 | 0.8681 | 0.8707 | 0.8746 | 0.8772 |
| Camarilla | 0.8649 | 0.8655 | 0.8661 | 0.8667 | 0.8673 | 0.8679 | 0.8685 |
| Woodie | 0.8570 | 0.8613 | 0.8635 | 0.8678 | 0.8700 | 0.8743 | 0.8765 |
| Fibonacci | 0.8616 | 0.8641 | 0.8657 | 0.8681 | 0.8706 | 0.8722 | 0.8746 |
| Pivot points | S3 | S2 | S1 | PP | R1 | R2 | R3 |
|---|---|---|---|---|---|---|---|
| Standard | 0.8666 | 0.8718 | 0.8783 | 0.8835 | 0.8900 | 0.8952 | 0.9017 |
| Camarilla | 0.8815 | 0.8826 | 0.8836 | 0.8847 | 0.8858 | 0.8869 | 0.8879 |
| Woodie | 0.8672 | 0.8721 | 0.8789 | 0.8838 | 0.8906 | 0.8955 | 0.9023 |
| Fibonacci | 0.8718 | 0.8763 | 0.8791 | 0.8835 | 0.8880 | 0.8908 | 0.8952 |
| Pivot points | S3 | S2 | S1 | PP | R1 | R2 | R3 |
|---|---|---|---|---|---|---|---|
| Standard | 0.8408 | 0.8512 | 0.8700 | 0.8804 | 0.8992 | 0.9096 | 0.9284 |
| Camarilla | 0.8807 | 0.8834 | 0.8860 | 0.8887 | 0.8914 | 0.8941 | 0.8967 |
| Woodie | 0.8449 | 0.8533 | 0.8741 | 0.8825 | 0.9033 | 0.9117 | 0.9325 |
| Fibonacci | 0.8512 | 0.8624 | 0.8693 | 0.8804 | 0.8916 | 0.8985 | 0.9096 |
Numerical data
The following is the status of the technical indicators and moving averages at the time of publication of this technical analysis:
| RSI (14): | 33.86 | |
| MACD (12,26,9): | -0.0030 | |
| Directional Movement: | -17.7071 | |
| AROON (14): | -92.8571 | |
| DEMA (21): | 0.8766 | |
| Parabolic SAR (0,02-0,02-0,2): | 0.8839 | |
| Elder Ray (13): | -0.0110 | |
| Super Trend (3,10): | 0.8849 | |
| Zig ZAG (10): | 0.8675 | |
| VORTEX (21): | 0.8529 | |
| Stochastique (14,3,5): | 5.90 | |
| TEMA (21): | 0.8738 | |
| Williams %R (14): | -92.80 | |
| Chande Momentum Oscillator (20): | -0.0149 | |
| Repulse (5,40,3): | -1.0928 | |
| ROCnROLL: | 2 | |
| TRIX (15,9): | -0.0102 | |
| Courbe Coppock: | 2.45 |
| MA7: | 0.8772 | |
| MA20: | 0.8820 | |
| MA50: | 0.8813 | |
| MA100: | 0.8821 | |
| MAexp7: | 0.8743 | |
| MAexp20: | 0.8795 | |
| MAexp50: | 0.8815 | |
| MAexp100: | 0.8822 | |
| Price / MA7: | -1.08% | |
| Price / MA20: | -1.62% | |
| Price / MA50: | -1.54% | |
| Price / MA100: | -1.63% | |
| Price / MAexp7: | -0.75% | |
| Price / MAexp20: | -1.34% | |
| Price / MAexp50: | -1.57% | |
| Price / MAexp100: | -1.64% |
News
The last news published on NZD/CAD at the time of the generation of this analysis was as follows:
-
 New Zealand Dollar Soars on RBNZ: NZD/USD, NZD/JPY, NZD/CAD Analysis
-
Quick Takes Video: Volatility vs Inevitability for USD/CAD, NZD/JPY, NZD/CAD
-
NZD/CAD To Potentially Reach Parity
About author

Online


Add a comment
Comments
0 comments on the analysis NZD/CAD - Daily