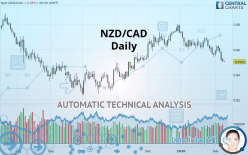
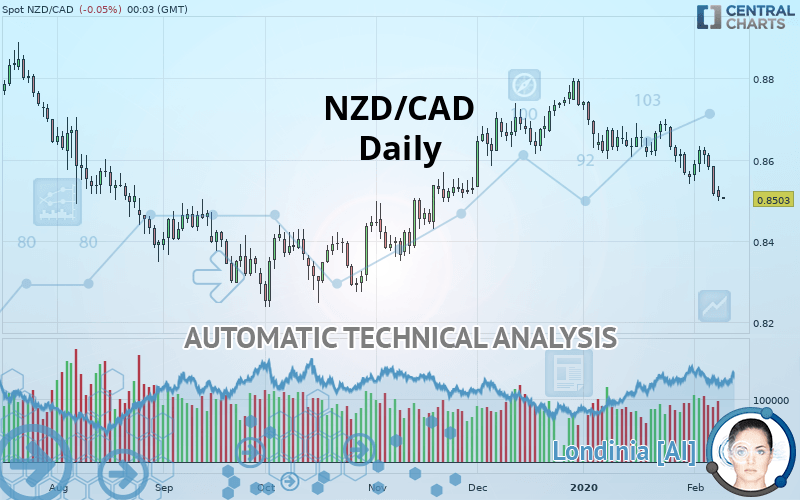
NZD/CAD - Daily - Technical analysis published on 02/11/2020 (GMT)
- Who voted?
- 237
- 0
Click here for a new analysis!
- Timeframe : Daily
- - Analysis generated on
- Status : TARGET REACHED
Summary of the analysis

Additional analysis
Quotes
The NZD/CAD price is 0.8504 CAD. The price is lower by -0.04% since the last closing with the lowest point at 0.8502 CAD and the highest point at 0.8507 CAD. The deviation from the price is +0.02% for the low point and -0.04% for the high point.A bullish opening was detected by the Central Gaps scanner. Buyers are trying to impose a bullish momentum in the very short term.
Bullish opening
Type : Bullish
Timeframe : Openning
So that you have an overall view of the price change, here is a table showing the variations over several periods:
Technical
Technical analysis of NZD/CAD in Daily shows an overall bearish trend. 67.86% of the signals given by moving averages are bearish. The overall trend is reinforced by the strong bearish signals from short-term moving averages. The Central Indicators market scanner is currently detecting several bearish signals that could impact this trend:
Bearish trend reversal : Moving Average 50
Type : Bearish
Timeframe : Daily
Bearish price crossover with Moving Average 100
Type : Bearish
Timeframe : Daily
The probability of a further decline is high given the direction of the technical indicators.
Caution: the Central Indicators scanner currently detects an excess:
CCI indicator is oversold : under -100
Type : Neutral
Timeframe : Daily
Williams %R indicator is oversold : under -80
Type : Neutral
Timeframe : Daily
Ichimoku : price is under the cloud
Type : Bearish
Timeframe : Daily
Price is back under the pivot point
Type : Bearish
Timeframe : Daily
Price is back under the pivot point
Type : Bearish
Timeframe : Weekly
The Central Patterns scanner, which studies chart patterns, resistances and supports, has identified these signals:
Near support of channel
Type : Bullish
Timeframe : Daily
Horizontal support is broken
Type : Bearish
Timeframe : Daily
Central Candlesticks, the scanner specialised in Japanese candlesticks, detects a bearish signal that could support the hypothesis of a small drop in the very short term:
Three black crows
Type : Bearish
Timeframe : Daily
| S3 | S2 | S1 | Price | R1 | R2 | R3 | |
|---|---|---|---|---|---|---|---|
| ProTrendLines | 0.8330 | 0.8417 | 0.8467 | 0.8504 | 0.8556 | 0.8620 | 0.8682 |
| Change (%) | -2.05% | -1.02% | -0.44% | - | +0.61% | +1.36% | +2.09% |
| Change | -0.0174 | -0.0087 | -0.0037 | - | +0.0052 | +0.0116 | +0.0178 |
| Level | Major | Minor | Minor | - | Intermediate | Minor | Major |
Pivot points can also be used to set your price objectives. Here is the price situation in relation to pivot points:
| Pivot points | S3 | S2 | S1 | PP | R1 | R2 | R3 |
|---|---|---|---|---|---|---|---|
| Standard | 0.8414 | 0.8461 | 0.8489 | 0.8536 | 0.8564 | 0.8611 | 0.8639 |
| Camarilla | 0.8495 | 0.8502 | 0.8509 | 0.8516 | 0.8523 | 0.8530 | 0.8537 |
| Woodie | 0.8450 | 0.8474 | 0.8488 | 0.8531 | 0.8554 | 0.8606 | 0.8629 |
| Fibonacci | 0.8475 | 0.8490 | 0.8499 | 0.8513 | 0.8528 | 0.8537 | 0.8551 |
| Pivot points | S3 | S2 | S1 | PP | R1 | R2 | R3 |
|---|---|---|---|---|---|---|---|
| Standard | 0.8347 | 0.8428 | 0.8472 | 0.8553 | 0.8597 | 0.8678 | 0.8722 |
| Camarilla | 0.8482 | 0.8493 | 0.8505 | 0.8516 | 0.8528 | 0.8539 | 0.8550 |
| Woodie | 0.8329 | 0.8419 | 0.8454 | 0.8544 | 0.8579 | 0.8669 | 0.8704 |
| Fibonacci | 0.8428 | 0.8476 | 0.8505 | 0.8553 | 0.8601 | 0.8630 | 0.8678 |
| Pivot points | S3 | S2 | S1 | PP | R1 | R2 | R3 |
|---|---|---|---|---|---|---|---|
| Standard | 0.8279 | 0.8409 | 0.8483 | 0.8613 | 0.8687 | 0.8817 | 0.8891 |
| Camarilla | 0.8500 | 0.8519 | 0.8537 | 0.8556 | 0.8575 | 0.8593 | 0.8612 |
| Woodie | 0.8250 | 0.8395 | 0.8454 | 0.8599 | 0.8658 | 0.8803 | 0.8862 |
| Fibonacci | 0.8409 | 0.8487 | 0.8535 | 0.8613 | 0.8691 | 0.8739 | 0.8817 |
Numerical data
The following is the status of technical indicators and moving averages registered at the time this technical analysis was created:
| RSI (14): | 34.35 | |
| MACD (12,26,9): | -0.0029 | |
| Directional Movement: | -13.4620 | |
| AROON (14): | -78.5714 | |
| DEMA (21): | 0.8571 | |
| Parabolic SAR (0,02-0,02-0,2): | 0.8623 | |
| Elder Ray (13): | -0.0060 | |
| Super Trend (3,10): | 0.8639 | |
| Zig ZAG (10): | 0.8505 | |
| VORTEX (21): | 0.8548 | |
| Stochastique (14,3,5): | 4.01 | |
| TEMA (21): | 0.8538 | |
| Williams %R (14): | -97.54 | |
| Chande Momentum Oscillator (20): | -0.0186 | |
| Repulse (5,40,3): | -1.1525 | |
| ROCnROLL: | 2 | |
| TRIX (15,9): | -0.0314 | |
| Courbe Coppock: | 1.92 |
| MA7: | 0.8568 | |
| MA20: | 0.8613 | |
| MA50: | 0.8656 | |
| MA100: | 0.8532 | |
| MAexp7: | 0.8560 | |
| MAexp20: | 0.8602 | |
| MAexp50: | 0.8610 | |
| MAexp100: | 0.8594 | |
| Price / MA7: | -0.75% | |
| Price / MA20: | -1.27% | |
| Price / MA50: | -1.76% | |
| Price / MA100: | -0.33% | |
| Price / MAexp7: | -0.65% | |
| Price / MAexp20: | -1.14% | |
| Price / MAexp50: | -1.23% | |
| Price / MAexp100: | -1.05% |
News
The latest news and videos published on NZD/CAD at the time of the analysis were as follows:
-
 Quick Takes Video: Volatility vs Inevitability for USD/CAD, NZD/JPY, NZD/CAD
-
NZD/CAD To Potentially Reach Parity
About author

Online


Add a comment
Comments
0 comments on the analysis NZD/CAD - Daily