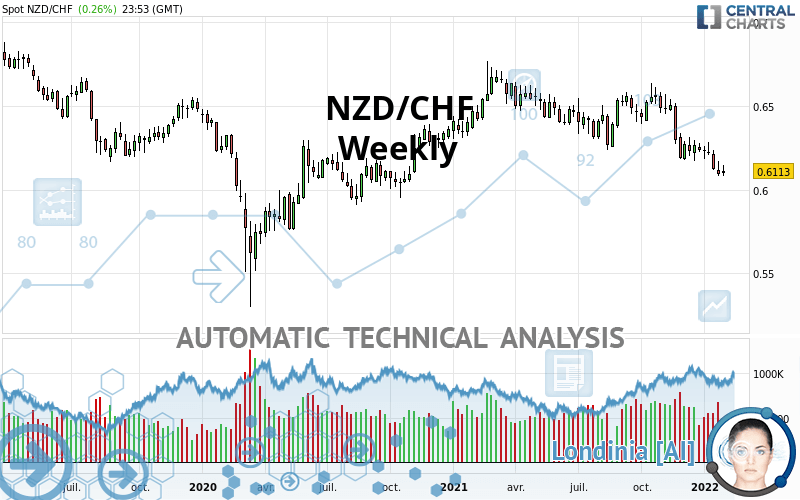
NZD/CHF - Weekly - Technical analysis published on 02/01/2022 (GMT)
- 207
- 0
Click here for a new analysis!
- Timeframe : Weekly
- - Analysis generated on
- Status : INVALID

Summary of the analysis

Additional analysis
Quotes
NZD/CHF rating 0.6113 CHF. The price registered a decrease of -0.42% over 5 days and has been traded over the last 5 days between 0.6081 CHF and 0.6144 CHF. This implies that the 5 day price is +0.53% from its lowest point and -0.50% from its highest point.A bullish opening was detected by the Central Gaps scanner. Buyers are trying to impose a bullish momentum in the very short term.
Bullish opening
Type : Bullish
Timeframe : Openning
A study of price movements over other periods shows the following variations:
New LOW record (1 year)
Type : Bearish
Timeframe : Weekly
Near a new HIGH record (1st january)
Type : Bullish
Timeframe : Weekly
New LOW record (1st january)
Type : Bearish
Timeframe : Weekly
Near a new HIGH record (1 month)
Type : Bullish
Timeframe : Weekly
New LOW record (1 month)
Type : Bearish
Timeframe : Weekly
Technical
Technical analysis of this Weekly chart of NZD/CHF indicates that the overall trend is bearish. 75.00% of the signals given by moving averages are bearish. This bearish trend is supported by the strong bearish signals given by short-term moving averages. An assessment of moving averages reveals a bullish signal that could impact this trend:
Bullish trend reversal : Moving Average 100
Type : Bullish
Timeframe : Weekly
Technical indicators are strongly bearish, suggesting that the price decline is expected to continue.
But beware of excesses. The Central Indicators scanner currently detects this:
CCI indicator is oversold : under -100
Type : Neutral
Timeframe : Weekly
CCI indicator: bullish divergence
Type : Bullish
Timeframe : Weekly
RSI indicator: bullish divergence
Type : Bullish
Timeframe : Weekly
Williams %R indicator is oversold : under -80
Type : Neutral
Timeframe : Weekly
Price is back over the pivot point
Type : Bullish
Timeframe : Weekly
An analysis of the price chart with the Central Patterns scanner (detector of chart patterns and resistances and supports) shows several results that can have an impact on the price change:
Near horizontal support
Type : Bullish
Timeframe : Weekly
Support of channel is broken
Type : Bearish
Timeframe : Weekly
No result was found by the Central Candlesticks scanner on Japanese candlesticks.
| S2 | S1 | Price | R1 | R2 | R3 | |
|---|---|---|---|---|---|---|
| ProTrendLines | 0.5531 | 0.6031 | 0.6113 | 0.6316 | 0.6615 | 0.6742 |
| Change (%) | -9.52% | -1.34% | - | +3.32% | +8.21% | +10.29% |
| Change | -0.0582 | -0.0082 | - | +0.0203 | +0.0502 | +0.0629 |
| Level | Intermediate | Major | - | Minor | Minor | Intermediate |
To determine price objectives, it is also possible to use the pivot points. Here is the price position in relation to pivot points:
| Pivot points | S3 | S2 | S1 | PP | R1 | R2 | R3 |
|---|---|---|---|---|---|---|---|
| Standard | 0.6018 | 0.6052 | 0.6075 | 0.6109 | 0.6132 | 0.6166 | 0.6189 |
| Camarilla | 0.6081 | 0.6087 | 0.6092 | 0.6097 | 0.6102 | 0.6108 | 0.6113 |
| Woodie | 0.6012 | 0.6049 | 0.6069 | 0.6106 | 0.6126 | 0.6163 | 0.6183 |
| Fibonacci | 0.6052 | 0.6074 | 0.6088 | 0.6109 | 0.6131 | 0.6145 | 0.6166 |
| Pivot points | S3 | S2 | S1 | PP | R1 | R2 | R3 |
|---|---|---|---|---|---|---|---|
| Standard | 0.5974 | 0.6028 | 0.6061 | 0.6115 | 0.6148 | 0.6202 | 0.6235 |
| Camarilla | 0.6071 | 0.6079 | 0.6087 | 0.6095 | 0.6103 | 0.6111 | 0.6119 |
| Woodie | 0.5965 | 0.6023 | 0.6052 | 0.6110 | 0.6139 | 0.6197 | 0.6226 |
| Fibonacci | 0.6028 | 0.6061 | 0.6081 | 0.6115 | 0.6148 | 0.6168 | 0.6202 |
| Pivot points | S3 | S2 | S1 | PP | R1 | R2 | R3 |
|---|---|---|---|---|---|---|---|
| Standard | 0.5820 | 0.5950 | 0.6024 | 0.6154 | 0.6228 | 0.6358 | 0.6432 |
| Camarilla | 0.6041 | 0.6060 | 0.6078 | 0.6097 | 0.6116 | 0.6134 | 0.6153 |
| Woodie | 0.5791 | 0.5936 | 0.5995 | 0.6140 | 0.6199 | 0.6344 | 0.6403 |
| Fibonacci | 0.5950 | 0.6028 | 0.6076 | 0.6154 | 0.6232 | 0.6280 | 0.6358 |
Numerical data
The following are the details of the technical indicators and moving averages that were collected to generate this technical analysis:
| RSI (14): | 35.16 | |
| MACD (12,26,9): | -0.0086 | |
| Directional Movement: | -17.7423 | |
| AROON (14): | -92.8571 | |
| DEMA (21): | 0.6190 | |
| Parabolic SAR (0,02-0,02-0,2): | 0.6375 | |
| Elder Ray (13): | -0.0126 | |
| Super Trend (3,10): | 0.6427 | |
| Zig ZAG (10): | 0.6116 | |
| VORTEX (21): | 0.8167 | |
| Stochastique (14,3,5): | 3.80 | |
| TEMA (21): | 0.6118 | |
| Williams %R (14): | -92.79 | |
| Chande Momentum Oscillator (20): | -0.0371 | |
| Repulse (5,40,3): | -1.4462 | |
| ROCnROLL: | 2 | |
| TRIX (15,9): | -0.1300 | |
| Courbe Coppock: | 10.35 |
| MA7: | 0.6123 | |
| MA20: | 0.6186 | |
| MA50: | 0.6232 | |
| MA100: | 0.6368 | |
| MAexp7: | 0.6175 | |
| MAexp20: | 0.6288 | |
| MAexp50: | 0.6352 | |
| MAexp100: | 0.6368 | |
| Price / MA7: | -0.16% | |
| Price / MA20: | -1.18% | |
| Price / MA50: | -1.91% | |
| Price / MA100: | -4.00% | |
| Price / MAexp7: | -1.00% | |
| Price / MAexp20: | -2.78% | |
| Price / MAexp50: | -3.76% | |
| Price / MAexp100: | -4.00% |
News
Don't forget to follow the news on NZD/CHF. At the time of publication of this analysis, the latest news was as follows:
About author

Online


Add a comment
Comments
0 comments on the analysis NZD/CHF - Weekly