NZD/CHF - Daily - Technical analysis published on 08/03/2022 (GMT)
- 117
- 0
Click here for a new analysis!
- Timeframe : Daily
- - Analysis generated on
- Status : TARGET REACHED

Summary of the analysis

Additional analysis
Quotes
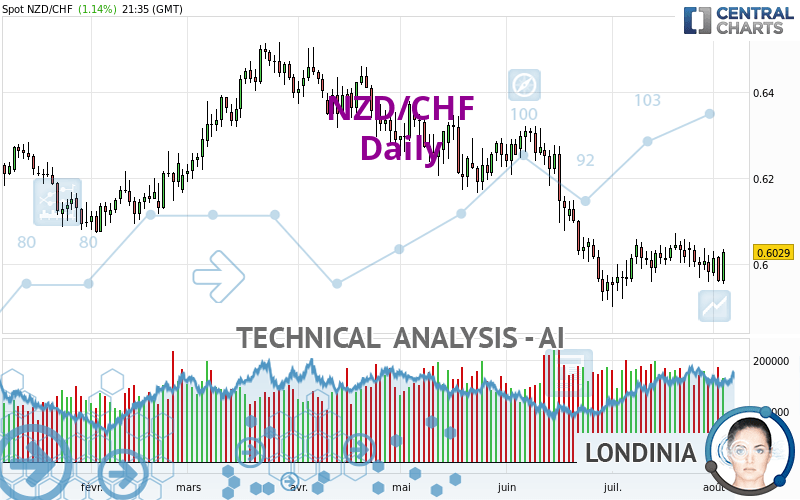
NZD/CHF rating 0.6029 CHF. The price has increased by +1.14% since the last closing and was between 0.5955 CHF and 0.6035 CHF. This implies that the price is at +1.24% from its lowest and at -0.10% from its highest.The Central Gaps scanner detects a bullish opening marking the presence of buyers ahead of sellers at the opening but not sufficiently marked to allow the price to register a quotation gap.
Bullish opening
Type : Bullish
Timeframe : Openning
Here is a more detailed summary of the historical variations registered by NZD/CHF:
Near a new LOW record (1 year)
Type : Bearish
Timeframe : Weekly
Near a new LOW record (1st january)
Type : Bearish
Timeframe : Weekly
Near a new HIGH record (1 month)
Type : Bullish
Timeframe : Weekly
Technical
Technical analysis of NZD/CHF in Daily shows an overall bearish trend. 71.43% of the signals given by moving averages are bearish. Caution: as the signals currently given by short-term moving averages are rather neutral, the bearish trend could slow down. An assessment of moving averages reveals several bullish signals that could impact this trend:
Bullish price crossover with Moving Average 20
Type : Bullish
Timeframe : Daily
Bullish price crossover with adaptative moving average 20
Type : Bullish
Timeframe : Daily
In fact, only 9 technical indicators out of 18 studied are currently positioned bullish. Caution: the Central Indicators scanner currently detects an excess:
Previous candle closed under Bollinger bands
Type : Neutral
Timeframe : Daily
Pivot points : price is over resistance 1
Type : Neutral
Timeframe : Daily
Price is back over the pivot point
Type : Bullish
Timeframe : Weekly
Momentum indicator is back over 0
Type : Bullish
Timeframe : Daily
Williams %R indicator is back over -50
Type : Bullish
Timeframe : Daily
Central Patterns, the market scanner focusing on chart patterns, resistances and supports found these results:
Near resistance of channel
Type : Bearish
Timeframe : Daily
Horizontal resistance is broken
Type : Bullish
Timeframe : Daily
No result was found by the Central Candlesticks scanner on Japanese candlesticks.
| S3 | S2 | S1 | Price | R1 | R2 | R3 | |
|---|---|---|---|---|---|---|---|
| ProTrendLines | 0.5531 | 0.5934 | 0.5991 | 0.6029 | 0.6040 | 0.6188 | 0.6267 |
| Change (%) | -8.26% | -1.58% | -0.63% | - | +0.18% | +2.64% | +3.95% |
| Change | -0.0498 | -0.0095 | -0.0038 | - | +0.0011 | +0.0159 | +0.0238 |
| Level | Major | Intermediate | Intermediate | - | Major | Intermediate | Intermediate |
Pivot points can also be used to set your price objectives. Here is the price situation in relation to pivot points:
| Pivot points | S3 | S2 | S1 | PP | R1 | R2 | R3 |
|---|---|---|---|---|---|---|---|
| Standard | 0.5879 | 0.5918 | 0.5940 | 0.5979 | 0.6001 | 0.6040 | 0.6062 |
| Camarilla | 0.5944 | 0.5950 | 0.5955 | 0.5961 | 0.5967 | 0.5972 | 0.5978 |
| Woodie | 0.5870 | 0.5914 | 0.5931 | 0.5975 | 0.5992 | 0.6036 | 0.6053 |
| Fibonacci | 0.5918 | 0.5942 | 0.5956 | 0.5979 | 0.6003 | 0.6017 | 0.6040 |
| Pivot points | S3 | S2 | S1 | PP | R1 | R2 | R3 |
|---|---|---|---|---|---|---|---|
| Standard | 0.5851 | 0.5905 | 0.5944 | 0.5998 | 0.6037 | 0.6091 | 0.6130 |
| Camarilla | 0.5957 | 0.5966 | 0.5975 | 0.5983 | 0.5992 | 0.6000 | 0.6009 |
| Woodie | 0.5844 | 0.5901 | 0.5937 | 0.5994 | 0.6030 | 0.6087 | 0.6123 |
| Fibonacci | 0.5905 | 0.5941 | 0.5963 | 0.5998 | 0.6034 | 0.6056 | 0.6091 |
| Pivot points | S3 | S2 | S1 | PP | R1 | R2 | R3 |
|---|---|---|---|---|---|---|---|
| Standard | 0.5725 | 0.5813 | 0.5898 | 0.5986 | 0.6071 | 0.6159 | 0.6244 |
| Camarilla | 0.5935 | 0.5951 | 0.5967 | 0.5983 | 0.5999 | 0.6015 | 0.6031 |
| Woodie | 0.5724 | 0.5812 | 0.5897 | 0.5985 | 0.6070 | 0.6158 | 0.6243 |
| Fibonacci | 0.5813 | 0.5879 | 0.5920 | 0.5986 | 0.6052 | 0.6093 | 0.6159 |
Numerical data
The following is the status of the technical indicators and moving averages at the time of publication of this technical analysis:
| RSI (14): | 49.53 | |
| MACD (12,26,9): | -0.0021 | |
| Directional Movement: | -6.6331 | |
| AROON (14): | -71.4286 | |
| DEMA (21): | 0.5985 | |
| Parabolic SAR (0,02-0,02-0,2): | 0.6055 | |
| Elder Ray (13): | -0.0013 | |
| Super Trend (3,10): | 0.6138 | |
| Zig ZAG (10): | 0.6024 | |
| VORTEX (21): | 1.0314 | |
| Stochastique (14,3,5): | 37.55 | |
| TEMA (21): | 0.6003 | |
| Williams %R (14): | -38.66 | |
| Chande Momentum Oscillator (20): | 0.0014 | |
| Repulse (5,40,3): | 0.7607 | |
| ROCnROLL: | -1 | |
| TRIX (15,9): | -0.0603 | |
| Courbe Coppock: | 0.33 |
| MA7: | 0.6000 | |
| MA20: | 0.6015 | |
| MA50: | 0.6092 | |
| MA100: | 0.6226 | |
| MAexp7: | 0.6004 | |
| MAexp20: | 0.6017 | |
| MAexp50: | 0.6081 | |
| MAexp100: | 0.6160 | |
| Price / MA7: | +0.48% | |
| Price / MA20: | +0.23% | |
| Price / MA50: | -1.03% | |
| Price / MA100: | -3.16% | |
| Price / MAexp7: | +0.42% | |
| Price / MAexp20: | +0.20% | |
| Price / MAexp50: | -0.86% | |
| Price / MAexp100: | -2.13% |
News
Don't forget to follow the news on NZD/CHF. At the time of publication of this analysis, the latest news was as follows:
About author
Online


Add a comment
Comments
0 comments on the analysis NZD/CHF - Daily